metro vancouver real estate

Declining Prices Continue Into the New Year

A new year is upon us, and I welcome you back from the holiday season just past.

Everyone is wondering of course, what the residential market will do in the year ahead of us. It’s natural to want to gaze into the proverbial crystal ball to predict the future. And while I’m afraid I don’t have such a fortune telling device, I can advise you on the trend that is continuing from the end of last year.

In general, average home prices (benchmarks) are showing slight declines each month, although there are still minor upticks here and there, which is normal in any active market. Looking back at 2018 we can see the skyrocketing prices that had been occurring since 2016 suddenly peaked at the end of June last year. They have been declining in small increments each month since. We can safely surmise that this dramatic reversal resulted from government measures to cool the market: provincial foreign ownership and speculation taxes combined with new federal rules for stricter mortgage qualification.

Add to all this, higher variable mortgage rates pushed up by Canada’s central bank’s rising interest rates and it’s easy to see why prices are dropping. In the last six months of 2018, the cumulative decline was 6.5 per cent.

Forecasts and current trends

The first thing I will say about this trend is that there is no reason to think it will not continue into the near future. But exactly how long is anybody’s guess. I want to be very upfront with you about this. I will not tell anyone to list or buy at a specific time based solely on market statistics for two reasons: First, even an educated guess is still a guess, and two (more importantly), there are many personal and individual factors that need to be taken into consideration in such an important transaction. What I am able to do for my clients during a period of indecision is to help them evaluate what their needs are, both financial and for living accommodations, and how to develop a sound strategic plan based on their individual circumstances. This may be something like setting a threshold or target price to wait for, or a preparing a comparative market analysis on a property you are considering at the present time. I have also been able to assist clients in deciding on renovations that will help to maximize their value when they decide to sell; or to help prospective buyers with the features they want for their individual tastes.

Newsletter in 2019

I will continue to provide a monthly snapshot of benchmark prices for all property types across the Lower Mainland based on the latest statistics. I know readers like to watch these monthly changes in average prices. The cooling market has shifted from a sellers’ market to a buyers’ market since July last year, meaning that buyers don’t have to make offers frantically, as they did when the prices were soaring. A couple of statistics that I will include in this new environment are one-year and ten-year comparisons so you can get some idea of what the current benchmarks mean during this current period.

Combined Benchmark

The combined benchmark for all property types in Metro Vancouver at the end of December 2018 was $1.032,400, a decrease 2.7 per cent decrease from one year earlier, and a 0.9 decrease from the preceding month. This benchmark price is 102.5 per cent higher than 10 years ago. In the Fraser Valley the combined benchmark for all property types at the end of 2018 was $834,700, an increase of 2.5 per cent from one year earlier and a 0.8 per cent decline from the previous month. This benchmark price is 97.0 per cent higher than 10 years ago.

METRO VANCOUVER BENCHMARKS

Detached Homes

The benchmark price for a single family detached home in Metro Vancouver at end of December 2018 was $1,479,7000, a decrease of 1.4 per cent from the preceding month. The extremities of this average were Vancouver West (not West Vancouver) at $3,138,400 and the Sunshine Coast at $613,700. (Note I include the region only as a factor in the average, but I do not report on housing prices in this area because it is to far away for my clients). The three municipalities with benchmarks closest on the higher side of the average were: Port Moody at $1,485,300, a decrease of 0.9 per cent from the preceding month; North Vancouver at $1,569,800, a decrease of 2.6 per cent from the preceding month; and Burnaby South at $1,569,800, a decline of 2.6 per cent from the preceding month. The three municipalities closest to the benchmark on the lower side of the average were: Burnaby North at $1,448,900, a decrease of 1.4 per cent from the preceding month; Vancouver East at $1,447,300, a decrease of 1.6 per cent from the preceding month; and Coquitlam at $1,214,300, a decrease of 1.3 per cent from the preceding month.

Townhouses

The benchmark price for a townhouse in Metro Vancouver at the end of December 2018 was $809,700, a decrease of 1.1 per cent from the preceding month. The extremities of the average were Vancouver West (not West Vancouver) at $1,140,900 and Maple Ridge at $360,800. The three municipalities closest on the higher side of this average were: Richmond at $819,800, a decrease of 2.4 per cent from the preceding month; Vancouver East $850,000, an increase of 2.3 per cent from the preceding month; and North Vancouver at $994,300, a decrease of 2.0 per cent from the preceding month. The three municipalities closest on the lower side of this average were: Burnaby South at $790,800, a decrease of 0.9 per cent from the preceding month; Ladner at $760,500, a decrease of 1.2 per cent from the preceding month; and Tsawwassen at $748,800, an increase of 1.3 per cent from the preceding month.

Condominiums

The benchmark price for condominium in Metro Vancouver at the end of December 2018 was $664,100, a decrease of 0.6 per cent from the previous month. The extremities of the average were West Vancouver at $1,140,900 and Maple Ridge at $360,800. The three municipalities closest on the higher side of this average were: Richmond at $668,500, an increase of 1.5 per cent from the preceding month; Burnaby South at $685,700, a decrease of 0.6 per cent from the preceding month; and Burnaby East at $770,300, an increase of 1.0 per cent from the preceding month. The three municipalities closest on the lower side of this average were: Port Moody at $627,300, a decrease of 2.9 per cent from the preceding month; Burnaby North at $619,100, a decrease of 2.1 per cent from the preceding month; and North Vancouver at $567,300, a decrease of 1.2 per cent from the preceding month.

FRASER VALLEY BENCHMARKS

Detached Homes

The benchmark price for a detached home in the Fraser Valley at the end of December was $965,300, a decrease of 1.1 per cent from the previous month. The extremities of this average were South Surrey/White Rock at $674,100 and Mission at $651,900. The three municipalities closest on the higher side of this average were North Surrey at $973,500, a decrease of 0.6 per cent from the preceding month; Cloverdale at $982,200, an increase of 0.1 per cent from the preceding month; and Langley at $1,003,000, a decrease of 0.6 per cent from the preceding month. The three municipalities closest on the lower side of this average were: North Delta at $887,800, a decrease of 2.8 per cent from the preceding month; Abbotsford at $792,600, a decrease of 1.3 per cent from the preceding month; and Mission at $651,900, a decrease of 0.4 per cent from the preceding month.

Townhouses

The benchmark price for a townhouse in the Fraser Valley at the end of December was $531,900, a decrease of 0.2 per cent from the preceding month. The extremities of this average were South Surrey/White Rock at $572,100 and Abbotsford at $314,000. The three municipalities closest on the higher side of this average were: Cloverdale at $550,400, a decrease of 0.9 per cent from the preceding month; North Surrey at $577,600, a decrease of 1.9 per cent from the preceding month; and Surrey at $581,000, an increase of 0.5 per cent from the preceding month. The three municipalities closest on the lower side of this average were: Langley at $494,700, a decrease of 0.4 per cent from the preceding month; Mission at $455,900, an increase of 2.7 per cent from the preceding month; and Abbotsford at $383,400, a decrease of 2.1 per cent from the preceding month.

Condominiums

The benchmark price for a condominium in the Fraser Valley at the end of December was $418,300, a decrease of 1.0 per cent from the preceding month. The extremities of this average were South Surrey/White Rock at $500,100 and Abbotsford at $314,000. The three municipalities closest on the higher side of this average were: Surrey at $428,200, a decrease of 0.9 per cent from the preceding month; Cloverdale at $468,100, a decrease of 0.7 per cent from the preceding month; and South Surrey/ White Rock at $500,100, a decrease of 1.2 per cent from the preceding month. The three municipalities closest on the lower side of this average were: Langley at $413,100, a decrease of 0.9 per cent from the preceding month; North Surrey at $409,600, a decrease of 1.0 per cent from the preceding month; and North Delta at $400,000, a decrease of 0.8 per cent from the preceding month.

QUESTIONS? PLEASE LET ME KNOW

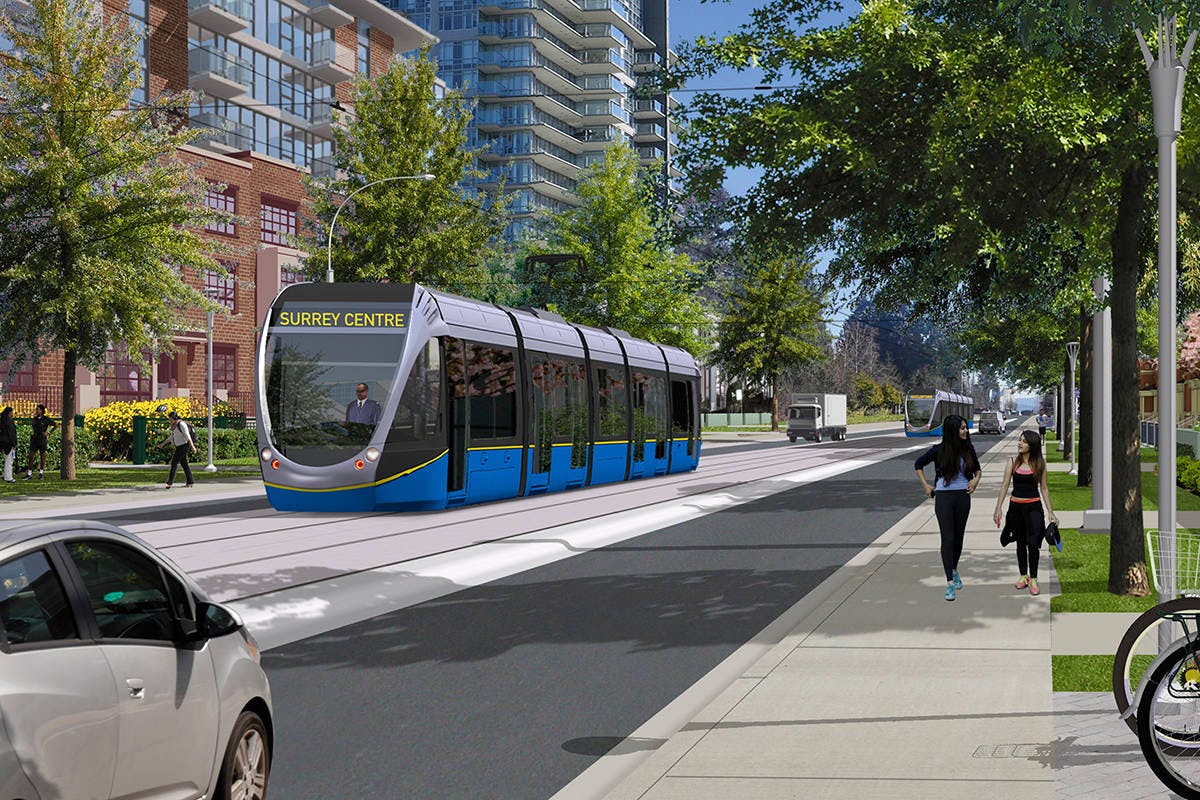
Please remember, I make my family home in Surrey and we are proud to see our city grow with the neighbourhood amenities that make for a wonderful life here. I am here to help with whatever your real estate needs may be. As a consistently recognized top-tier realtor, and with experience in finance, banking and real estate sales, I am happy to advise you, without pressure, so you can make a choice that will lead to your long-term happiness. Please let me know if I can help.

With my wife and two children, we wish you the very best for 2019.

Surrey Election

Surrey’s election day is coming later this month and I encourage everyone to familiarize themselves with the important issues being championed by the various slates as well as independent candidates. If you can’t make it to the poll on October 20, you can find six advance polling stations on October 6, 10, 11 and 13 by clicking here on the voting location map.

All voting locations are open from 8:00 am to 8:00 pm on Saturday, October 20th. Surrey voters will be electing a mayor and eight city councillors as well as six school trustees for School District No. 36.

Surrey’s LRT Debated – Again!

I normally wouldn’t provide my own opinion on how to vote, but in the forthcoming election there is one issue that has been raised recently by a couple of mayoral candidates, and I feel compelled comment to on it. It is the re-opening of a debate that has not only been completed, decided, and finalized, but for which funding from the federal and provincial governments as well as Translink has been secured, allocated and announced, namely plans for the city’s Light Rail Transit (LRT) system. In fact, preliminary construction along some corridors has already begun, and finally after years of consultations and planning, we are poised to get going with a much-needed transportation system for our region. To me it nothing short of irresponsible for politician to sow seeds of dissent at this time for their own political agenda, particularly politicians who previously supported the LRT. The two mayoral candidates who are trying to turn the clock back on this issue should be ashamed of themselves. Both Bruce Hayne, leader of the Integrity Now slate and Doug McCallum leader of the Safe Surrey Coalition, have made a 180-degree turnaround from their former positions supporting the LRT when they were previously in political office in Surrey. What kind of integrity does this show? There has been so much consultation and planning on this issue, years being examined by Translink’s Mayor’s Council and in Surrey City Hall, it is truly amazing that any politician should have the audacity to try to stir it all up again. Now they are prepared to reverse their positions just to satisfy their political ambitions, to create publicity through controversy, even it causes a setback to Surrey’s critical transportation for many more years.

Last May I wrote in my blog about the benefits of the LRT system for Surrey, including reduced congestion, increased traffic capacity, time savings and as a catalyst to local development including attracting and creating more jobs. In cities all over the world, LRT is generally considered more aesthetically pleasing to trains elevated by massive concrete pylons. An LRT creates more a sense of community as it can be boarded easily at street level and encourages people to leave their cars at home for many short trips, reducing GHG emissions as well. Surrey is the fastest growing urban municipality in Canada and is earning a great reputation as a culturally diverse and sophisticated centre recognized for its international character. An LRT transportation system can only enhance our civic environment as it has in beautiful cities around the world like Adelaide, Dublin, Rio de Janeiro and Edinburgh.

One of the problems with planning public transportation systems is that big budget projects are often poorly executed because the political bodies that make the decisions have much shorter in their terms in office than the length of the completed project. Financial decisions are too often forced into the short-term expediency or a political agenda or budget. While I fully support an open and democratically governed society, there are sometimes when I see the advantages of a centrally planned economy like China. The tremendous transportation systems that work for very heavily populated cities there could only be achieved with the kind of long-term projects that keep to a plan once it is settled. We almost need a transportation Czar here to get things done.

Let’s keep moving forward, not backwards.

Thanks for reading!

Sibo Zhang, REALTOR®

Image via Surrey Now-Leader

Your Market Update for July 2018

With the Bank of Canada’s recent announcement of an interest rate rise of 0.25 per cent, we are already seeing some commercial banks raise their prime mortgage rates. This is not a surprise and is in fact the fourth such interest rate increase by the Bank of Canada in the last 12 months. For anyone with a variable rate mortgage, their monthly payments will increase accordingly. For those who have not yet negotiated a mortgage and were hoping to do so soon, the rate will be slightly higher. But the effect of these rate increases is not all negative.

METRO VANCOUVER

I reported last month, various factors including higher interest rates and stricter mortgage requirements appear to be dampening demand for home sales in Metro Vancouver, and the latest figures show a decline in sales activities is continuing. The upside is that for prospective home buyers, the inventory of available homes at the end of June was at a three-year high. At the end of June, the total number of homes listed for sale in Metro Vancouver was 11,947, of which over 5,000 were listed in June alone. Yet, sales at the end of last month were close to 30 per cent below the ten-year average. So, I am encouraging anyone who is seriously looking for a home to take advantage of the big selection on the market now. With the reduced demand, you are less likely to get into a bidding war for a property you want. In fact, the overall Benchmark price of $1.093,600 for a residential property in Metro Vancouver at the end of June remained unchanged from the previous month. Anyone who has been watching prices escalate for several years will recognize the significance of the current price stability. It is a buyer’s market currently. Below I have selected areas for each of property type which are closest to the Metro benchmark on both the higher and lower sides of this average.

Detached Properties

The benchmark price for a detached home in Metro Vancouver at the end of June was $1,598,200, a decrease of 0.6 per cent from the preceding May. This benchmark average was made of benchmark prices between the extremities of the Sunshine Coast at $628,000 and Vancouver West at $3,392,500. (Note this is not West Vancouver which was at $2,944,900.) I have selected three areas which are closest on both sides for the Metro benchmark. On the higher side of the benchmark were: Richmond at $1,648,600, a decrease of 1.0 per cent from the preceding month; North Vancouver at $1,683,680, a decrease of 1.5 per cent from the preceding month; and Burnaby South at $1,712,400, an increase of 2.5 per cent from the preceding month. Closest to the Metro Benchmark on the lower side of the average were: Port Moody at $1,551,900, an increase of 1.5 per cent from the preceding May; Vancouver East at $1,541,400, a decrease of 0.1 per cent from the preceding May; and Burnaby North at $1,538,900, a decrease of 2.3 per cent from the preceding month.

Townhouses

The benchmark price for a townhouse in Metro Vancouver at the end of June was $859,800, which was unchanged from the preceding month. This benchmark average was made of benchmark prices between the extremities of Maple Ridge at $574,300 and West Vancouver at $1,303,600. I have selected three areas which are closest on both sides for the Metro benchmark. (I have excluded from this selection the areas of Squamish and Whistler which are too far out for most of my clients.) On the higher side of the benchmark were: Vancouver East at $923,400, a decrease of 0.3 per cent from the preceding May; North Vancouver at $1,049,900, an increase of 1.4 per cent from the preceding May; and Vancouver West at $1,303,600, a decrease of 0.1 per cent from the preceding May. Closest to the Metro benchmark on the lower side of the average were: Burnaby South at $856,400, an increase of 1.8 per cent from the preceding May; Richmond at $854,800, an increase of 1.0 per cent from the preceding May; and Ladner at $778,000, a decrease of 1.2 per cent from the preceding May.

Condominiums

The benchmark price for a condominium in Metro Vancouver at the end of June was $704,200, an increase of 0.4 per cent from the preceding May. This benchmark average was made of benchmark prices between the extremities of Pitt Meadows at $480,300 and West Vancouver at $1,286,500. I have selected three areas which are closest on both sides for the Metro benchmark. On the higher side of the average were: Burnaby South at $737,000 and increase of 1.1 per cent from the preceding May; Vancouver West at $842,600, a decrease of 0.3 per cent from the preceding May; and West Vancouver at $1,286,500, an increase of 0.5 per cent from the preceding May. Closest to the Metro benchmark on the lower side of the average were: Burnaby East at $701,400, a decrease of 2.0 per cent from the preceding May; Port Moody at $699,200, an increase of 0.9 per cent from the preceding May; and Richmond at $683,800, an increase of 2.0 per cent from the preceding May.

FRASER VALLEY

As it the case in Metro Vancouver, the inventory of residential properties in the Fraser Valley continued to increase. The total number of listings across all property types rose to 7,141 at the end of June, an increase of 6 per cent from the preceding May, providing an excellent selection for prospective home buyers this summer. If you haven’t yet found the residence you’ve been looking for in the Valley, then I strongly recommend you look at some newly listed properties this month. There were over 3,100 new listings in June alone. Prices are holding steady at present with a slight decrease in some cases – the average across all property types at the end of June decreased 4.9 per cent from the preceding May — so if you eager to buy this appears to be one a favourable time for buyers. Sales activity is still brisk, however, and properties can sell quite soon after they are listed. Last month the average time for a single family detached home was on the market in the Fraser Valley was 26 days; townhouses sold on average after 19 days, and condominiums after 21 days. As has been the case for some time, townhouses and condominiums make up just over 50 per cent of all sales, but detached properties are still a favourite for many families who want to enjoy Valley life with their children. Below is my selection this month for the three property types with benchmark prices at then end June in areas where I think you will find some excellent value.

Detached Homes

The benchmark price for a detached property in the Fraser Valley at the end June was $1, 018,900, a 0.2 per cent decrease from the preceding May. The extremities of this average were $1,073,700 in Langley and $692,300 in Mission. Here is my selection for the three closest benchmark prices on both the higher and lower sides of this Valley benchmark. On the higher side of the average were: Cloverdale at $1,036,600, a 1.1 per cent decrease from the preceding May; Surrey at $1,53,600, a 0.3 per cent increase from the preceding May; and Langley at $1,73,700, a 0.4 per cent increase from the preceding May. Closest to Fraser Valley benchmark on the lower side of the average were: North Surrey at $998,900, a 0.5 per cent decrease from the preceding May; North Delta at $957,800, a 0.1 per cent decrease from the preceding May; and $840,700, a 0.5 per cent increase from the preceding May.

Townhouses

The benchmark price for a townhouse in the Fraser Valley at the end of June was $558,000, an increase of 0.4 per cent from the preceding May. The extremities of this average were $680,800 in South Surrey/White Rock and $409,400 in Abbotsford. Here is my selection of the three closest benchmark prices on both the higher and lower sides of this Valley benchmark. On the higher side of the average were: North Surrey at $589,400, a decrease of 0.7 per cent from the preceding May; Surrey at $598,000, an increase of 0.9 per cent from the preceding May; and Cloverdale at $618,300, an increase of 0.2 per cent from the preceding May. Closest to the Valley benchmark on the lower side of the average were: Langley at $527,900, a decrease of 0.2 per cent from the preceding May; Mission at $441,800, a decrease of 1.8 per cent from the preceding May; and Abbotsford at $409,400, an increase of 3.5 per cent from the preceding May.

Condominiums

The benchmark price for condominium in the Fraser Valley at the end of June was $453,500, an increase of 0.1 per cent from the preceding May. The extremities of this average were $516,000 in South Surrey/White Rock and $356,800 in Abbotsford. Here is my selection of the three closest benchmark prices on both the higher and lower sides of this Valley benchmark. On the higher side of the average were: Surrey at $464,300, a decrease of 0.5 per cent from the preceding May; Cloverdale at $513,000, an increase of 0.6 per cent from the preceding May; and South Surrey/White Rock at $516,000, a decrease of 1.4 per cent from the preceding May. Closest to the Valley benchmark on the lower side of the average were: Langley at $448,500, a decrease of 1.2 per cent from the preceding May; North Surrey at $443,800, an increase of 1.0 per cent from the preceding May; and North Delta at $433,200, a decrease of 0.1 per cent.

The summer weather is now making it enjoyable to take a drive around the community where you would like to locate your new residence. I encourage you to view some of the open houses that you see and compare their features to what find properties priced close to the benchmark prices I have mentioned above. Remember that a benchmark price is an average based on home with similar characteristics, so be sure to note any features that you really want in your new home. I am always happy to provide you with more information in any property type in whatever area you are interested in, so please feel free to give me a call, whether you are just curious about the market or are at the stage of planning on buying or listing.

fr

April’s Market Update for Metro Vancouver and the Fraser Valley

OUR CURRENT RESIDENTIAL MARKET

As we move into the second quarter of 2018, I’m sure everyone is looking forward to more sunshine and fewer rainy days. The weather can be a factor in our outlook and affect our decision-making even on major transactions like buying or selling a residential property. That’s a good reason to pay close attention to some key market trends occurring in local prices and inventories. With so much recent news on new government regulations and taxes on property, it’s easy to develop negative views that are not wholly informed by the facts of the marketplace. Another thing that can contribute to unnecessary pessimism is an over-emphasis on longer term historical comparisons. Regular readers of my monthly newsletter get a picture of the marketplace which is as up-to-date as available statistics make possible, allowing them to understand the where and why of prevailing prices in a context that is relevant to current circumstances. I will continue to breakdown the market segments for each property type in the following geographical regions of Metro Vancouver and the Fraser Valley.

METRO VANCOUVER

In the past month of March there were total of 4,450 new listings in Metro Vancouver which was increase of 5.4 per cent over the preceding February. That’s good news for the active home seeker; yet, it’s fewer than the 4,762 listings that occurred in the same month one year ago. The latter statistic might be of interest in broader academic analysis of the Vancouver residential market, but it’s probably not going to affect a decision to buy or sell at the current time because the prevailing market psychology doesn’t believe that prices are going to move backwards in time. 00 For that reason, I am always talking to my clients to understand what they really want to know for the decisions that are important to them. And what I hear is that you wish to know about what is happening now, and in a context of what it points to in the near term. So here are my selected key metrics based on market activity tabulated on the end of last month.

Across all residential property types in Metro Vancouver there were 2,517 sales at the end of March. This was 14 per cent higher than the preceding month of February, so we can see there is still upward pressure on based on demand and the relatively low increase in new listings. At the end of March, the total inventory of listed homes in Metro Vancouver was 8,380. Breaking down the demand in each property type, we see 14.2 per cent for detached homes; 39.9 per cent for townhouses; and 61.6 per cent for condominiums. The composite Benchmark price for all Metro Vancouver residential properties at the end of March was $1,084,000, an increase of 1.1 per cent over one month. Below I will look at each property type in more detail.

Detached Properties

The Benchmark price for a detached residential property in the Greater Vancouver area at the end of March was $1,608,500, more than half a million dollars above the composite benchmark price for the region. This may give you an idea of a general price level. However,it needs to be considered in relationship to the property types factored into the composite benchmark, which we can look at under their individual headings below. For Single Family Detached homes, the Benchmark price is an average between price extremities of $3,449,000 in Vancouver West (noteworthy: higher than West Vancouver at $3,115,400.) and $606,000 on the Sunshine Coast. I have selected three municipalities closest on the upper side of the Benchmark, and three which are closest on the lower side, where you can see the price change in the past month. On the higher side of the Benchmark were South Burnaby at $1,673,700, a decline of 0.5 per cent in one month; Richmond at $1,708,400, an increase of 0.6 per cent in one month; and North Vancouver at $1,723,200, an increase of 2.2 per cent in one month. On the lower side of the Benchmark are North Burnaby at $1,544,100, an increase of 0.7 per cent in one month; Vancouver East at $1,553,100, a decrease of 0.5 per cent in one month; and Port Moody at $1,484,800, an increase of 0.1 per cent in one month.

Townhouses

The Benchmark price for townhouses in the Greater Vancouver area at the end of March was $835,300, an increase of 2.0 per cent over one month. This average had extremities of $1,271,000 in Vancouver West, and increase of 1.7 per cent in one month; and $575,100 in Maple Ridge, an increase of 4.3 per cent in one month. Excluding Squamish and Whistler for their distance from Metro Vancouver, I have selected three municipalities closest on each side of the Benchmark. On the upper side are Vancouver East at $908,200, an increase of 4.5 per cent in one month; North Vancouver at $1,005,400, an increase of 0.7 per cent in one month; and Vancouver West at $1,271,000, an increase of 1.7 per cent in one month.

Condominiums

The Benchmark price for condominiums in the Greater Vancouver areas at the end of March was $693,500, an increase of 1.6 per cent in one month. The extremities for this average were West Vancouver at $1,278,600 and Ladner at $459,300. Again, excluding Squamish and Whistler because of their distance for Metro Vancouver buyers, here are three municipalities with closest prices on the upper and lower side of the Benchmark, along with their month over month price change: South Burnaby at $727,300, an increase of 2.4 per cent in one month; East Burnaby at $727,800, an increase of 3.0 per cent in one month; and Vancouver West at $844,700, an increase of 1.1 per cent in one month. Closest to the Benchmark on the lower side were Port Moody at $675,000, an increase of 1.0 per cent in month; Richmond at $659,700, an increase of 0.3 per cent in one month; and North Burnaby at $641,600, a decrease of 0.1 per cent in one month.

FRASER VALLEY

The Valley continues to be a very active market which shows no sign of slowing. With Spring around the corner, I urge anyone who is seriously contemplating a purchasing a Valley residence of any type to take advantage of open houses in their desired category. There were 2,865 new listings in March which was a close to a 25 per cent increase from February’s new listings. Keep in mind that new property listings in an active market can attract more prospective buyers, especially as the weather invites more viewers. Even with an increased inventory, demand is still very strong putting upward pressure on prices. At the end of last month there was a total inventory almost 5,000 properties overall. Townhouses and condominiums made up just over 50 per cent of all Valley sales and were the fastest to sell after their listing, on average 16 days for a townhouse and 13 days for a condominium. Single detached homes sold on average in 30 days after listing. Below I examine at each property type by their current Benchmark prices and make some recommendations on which municipalities you might wish to look.

Single Family Detached

A major milestone has been reached in the Fraser Valley. The million-dollar mark for a single detached residence was reached for the first time at the end of March with a Benchmark price $1,001,400, an increase of 0.9 per cent in one month. We have been waiting for several months to see this threshold reached. It now remains to be seen if this will be a psychological threshold as well, both for buyers and sellers. For the former, some prospective buyers may decide they are now priced out of a single detached home and begin to look for a home of another property type. For sellers, we will have to see if the new price level encourages more listings. Focusing on prices closest to this Benchmark average, along with their month-over-month price change, here is my standard selection of three areas above and below the Benchmark. On the upper side of the Benchmark were: Langley at $1.026,600, a decrease of 0.2 per cent in one month; Surrey at $1,031,500, an increase of 1.2 per cent in one month; and Cloverdale at $1,045,400, an increase of 0.8 per cent in one month. Closest on the lower side of the Benchmark price were: North Surrey at $980,100, an increase of 0.8 per cent in one month; North Delta at $950,200, an increase of 0.6 per cent in one month; and Abbotsford at $814,000, an increase of 1.3 per cent in one month.

Townhouses

The Benchmark price for a Fraser Valley townhouse at the end of March was $541,800, an increase of 2.0 per cent in one month. The extremities of this average were South Surrey/White Rock at $678,000 and Abbotsford at $383,000. Municipalities with prices closest to the Benchmark were: On the upper side, North Surrey at $573,800, an increase of 2.4 per cent in one month; Surrey at $577,800, an increase of 1.6 per cent in one month; and North Delta at $591,300, an increase of 1.8 per cent in one month; closest on the lower side of the Benchmark were: Langley at $514,900, an increase of 1.3 per cent in one month; Mission at $446,500, an increase of 3.0 per cent in one month; and Abbotsford at $383,000, an increase of 3.1 per cent in one month.

Condominiums

The Valley Benchmark at the end of March for condominiums was $440,400, an increase of or 4.3 per cent in one month. The extremities for this average were South Surrey/White Rock at $524,100 and Mission at $329,500. Municipalities with prices closest on the upper side of this Benchmark were: Langley at $444,500, an increase of 4.8 per cent in one month; Surrey at $452,300, an increase of 5.8 per cent in one month; and Cloverdale at $507,100, an increase of 3.9 per cent in one month. On the lower side of the Benchmark, the closest prices were in North Delta at $425,900, an increase of 8.1 per cent in one month; North Surrey, at $424,900, an increase of 3.5 per cent in one month; and Abbotsford at $336,600, an increase of 6.6 per cent in one month.

AFTERWORD

In closing, I suggest you pay close attention to any trends you may spot in the month-over-month increases in Benchmark prices that I mention in each newsletter. This may help you see where prices are driven by demand and as you become familiar with increases – or decreases – in the short term, this may assist your decision making. However, keep in mind that there may be other factors that cause price changes which is out of the usual range. If you have any questions and need specific information on any housing type in any of the areas in the lower mainland, please don’t hesitate to call me. I keep an close eye on the residential market, and I want to help my clients find what they are looking for, or to make a listing decision when the time is right.

Thanks for reading!

Sibo Zhang, REALTOR®

B.C.’s New Real Estate Taxes – Part 2

The Additional Property Transfer Tax

As mentioned in my last blog in March, one of two new real estate taxes announced by the B.C. government in its 2018 budget this past February is the Additional Property Transfer Tax. In this blog I will provide an outline of the measures covered by this tax and highlight some of the main points that could affect current B.C. property owners and prospective home buyers.

Prior to February 21, 2018, the property tax transfer rate was 15 % on properties in the Greater Vancouver Regional District. After February 21, the transfer tax increased from 15 % to 20 %, based on the fair market value at the time of registration for property transfers in the following areas in the province of British Columbia:

  • Greater Vancouver Regional District
  • Capital Regional District
  • Fraser Valley Regional District
  • Regional District of Central Okanagan
  • Regional District of Nanaimo

Two Important Exceptions

Excluding the Greater Vancouver Regional District, the remaining four regions noted above have two instances where you don’t have to pay the additional transfer tax on property transfers after February 21: First, you don’t have to pay if you register before, or on, May 18, 2018, as long as the property transfer is subject to a written agreement dated on or before February 20, 2018; and second, if the transfer is subject to a court order dated before February 20, 2018, or several other specific legal conditions on property transfers related to divorces, separations, or estates of deceased persons. I advise you to get advice from your lawyer if any of these situations applies to you.

As a general guide, the changes introduced on the property tax transfer took effect February 21, 2018. If you purchase a property that is registered at the provincial Land Title Office, you will need to pay certain transaction costs which are taxable. Without going into the details of the various legally required transactions – which your Realtor can explain to you – I want to point out to you that you can qualify for a reduced tax if you are: a) purchasing your first home; or b) purchasing a newly built home.

The tax is calculated on the fair market value at the time of property registration. Note that properties on the Tsawwassen First Nation lands are exempt from the additional property transfer tax. There are also two other exemptions which I would advise you get legal advice if you not sure they apply to you. The first is any exemption that applied to you for the previous property tax transfer also exempts you from the additional transfer tax, except in the following situations: i) a transfer resulting from an amalgamation; ii) a transfer to a surviving tenant; iii) a transfer where the transferee is or becomes a trustee in relation to the property, even if the trust does not change; and second, if you are confirmed B.C. Provincial Nominee and certain criteria are met for foreign nationals under the B.C. Provincial Nominee Program.

Foreign Nationals and Foreign Entities

If you are a confirmed under the B.C. Provincial Nominee Program when the property transfer is registered with the Land Title Office; ii) the property is to be used as your principal residence; iii) the property transfer is made to an individual. Note that the additional property transfer tax does NOT apply to registration of mutual fund trusts, real estate investment trusts or specified flow-through trusts. You should also note that if you were confirmed as a B.C. Provincial Nominee between August 2, 2016 and March 17, 2017, you might be eligible for a refund of the additional transfer tax if you paid it.

If you happen to be a foreign national, a foreign corporation, or a taxable trustee, there is also an additional transfer tax on residential properties in certain areas of British Columbia, as listed above.

This summary of the new Additional Property Tax is based on information provided by the Government of British Columbia. I have summarized what I think are the major points of interests for my clients; however, like any tax measures, there are always situations that may require more in depth information. I would recommend that if you think you may be in such a situation that you talk to a knowledgeable tax lawyer about your specific situation. I hope the above summary has informed you adequately to understand if the new transfer tax may apply to you, You may find additional information on the new transfer tax at: B.C. Provincial Budget Tax Changes.

I will watch for any changes in these tax rules and report what I see in the blog space. Please feel free to ask for any advice that I might be able to provide. I’m always happy to help in any way I can.

Thanks for reading!

Sibo Zhang, REALTOR®

B.C.’s New Real Estate Taxes (Part 1)

You have probably heard about two new taxes related to real estate transactions in the province of British Columbia. In order to give you a general understanding and to highlight some key issues that may affect prospective home buyers, I will devote this blog and my next one to these new taxes announced in the B.C. provincial budget this past February. In this blog I focus on the new Speculation Tax. In my next blog in early April, I will discuss the province’s Additional Property Tax Transfer.

New Speculation Tax

The British Columbia government announced in its 2018 Budget in February that it would introduce what is called a Speculation Tax which will affect some home owners and prospective home buyers. At this time, the government has not released all the details of this new tax, but in the blog I will outline the general features of the proposed legislation as there are many questions owing to a lot media attention on the topic.

The first thing I want to draw to the attention of my readers is that the majority of homeowners in B.C. will be exempt from the tax, which will apply initially in Metro Vancouver, the Fraser Valley, the Capital Regional District, the Nanaimo Regional District, and in the municipalities of Kelowna and West Kelowna. Home owners will receive first tax notice in the fall of 2018.

The government has said it will be effective for the 2018 tax year, and that it will target foreign and domestic persons who are speculating with their purchases of residential properties in the province. The tax rate for 2018 will be $5.00 per $1,000 of the assessed property value. In 2019, the rate will increase to $20.00 per $1,000 of assessed value. The government’s early information on what this means is not highly detailed yet, but its intent seems quite clear. Speculators will be considered as home owners who are primarily interested in the rising value their property may acquire during a time that it is not occupied by the owner, or a least occupied very little of the time, and is not a long-term rental property. Long-term rental properties will be exempt from the tax, but short-term rentals by out of province owners will be taxed.

Without digressing from the basic facts of the new tax, I think it’s safe to assume that this tax measure is an attempt to keep speculators from driving up housing prices by buyers who wish to invest in a residence to make money primarily from its rising value and not as place to live as a principal residence. In fact, the government’s preliminary information describes some of these owners as “Satellite families – households with high worldwide income that pay little income tax in B.C.”

Tax Credit for B.C. Residents Affected by the New Tax

For B.C. residents who may be caught by the tax because they vacate their home for extended vacations, or who may wish to rent the property on a short-term basis, the provincial government is going to implement a corresponding income tax credit to help offset the tax for B.C. residents. More information on this income tax credit has been promised by the government before the tax is implemented, but it has announced that Satellite families will not be eligible for a principal residence exemption, although they will still be eligible to claim the income tax credit – to the extent that they pay tax in British Columbia.

In cases where a B.C. resident who own two homes, for example a principal resident in Vancouver and a vacation property in Kelowna, they would be able to apply for the B.C. income tax credit. In other words, the vacation property will be subject to the new tax, but the owner will be able to claim an income tax credit in such a case. The B.C. government has said that among its goals for the new tax will be to minimize the administrative compliance burden for the vast majority of home owners who will be claiming the up-front exemption. The objective is to reduce the number of notices that will need to be sent in future years.

Obviously, there are many questions that need to be answered at this time. B.C. property owners that may be subject to the tax will want to know the definitions of key terms such as short-term and long-term rentals, and other specifics of the new speculation tax. I will endeavor to provide additional information for my readers when it is available. The B.C. government has said it will issue notices by mail to advise residential property owners to a B.C. Government website that will have an electronic tax form or phone numbers with more information. Until then, you may find some information at www.gov.bc.ca/propertytaxes

Thanks for reading!

Sibo Zhang, REALTOR®

Your March Market Update for Metro Vancouver and the Fraser Valley

If you happened to read the news story in the Globe and Mail at the beginning of the month, the headline surely intrigued you: “Vancouver housing sales fall 9 % in February.” The story behind the decline is really the more important consideration for prospective home buyers. As a statistician, I always want my clients to understand the reason when a number is cited.

First, the February sales decline is for all property types across Metro Vancouver, so we will have to look more closely at the different categories. Based on ten-year sales average, February’s sales for all property types were down 14.4 per cent; detached sales declined 39.4 per cent; townhouse declined 6.8 per cent, but condominium sales rose 5.5 per cent above the 10-year average. Second, the 9 per cent decrease is a comparison with February sales in 2017. It’s a significant percentage, but the actual number of sales for the respective months were 2,207 in 2018 and 2,424 in 2017, so in practical terms not really a huge difference. And the number of sales in February this year was a monthly increase of 21.4 per cent over January, so it’s important to recognize that the market is still very active. The composite benchmark price for all residential properties in Metro Vancouver at the end of February was $1,071.800, a 16.9 per cent increase year-over-year and a 1.4 per cent increase since January this year. It will be important to watch these two price levels in coming months.

What the newspaper story was really about what may be the beginning of fewer sales each month following the provincial budget announcements in February that impact out-of-province buyers. The BC government has targeted speculative buyers with an additional tax as well as increasing and expanding the foreign buyers tax beyond Metro Vancouver. I will talk more about these tax measures in my next Blog, but for now I will focus on the market place prices for prospective local home buyers and sellers.

Detached Properties

The benchmark price for a single detached property in Greater Vancouver at the end of February was $1,602,000, an 8.2 per cent increase from the February 2017, and a 1.9 per cent increase from January this year. The extremities of this average range from a high in Vancouver West (higher than West Vancouver, and excluding Whistler) at $3,500,600 to a low in low in Maple Ridge at $847,700. That’s obviously quite a large spread, so I’ve selected three areas on each side of the Benchmark where you can find properties closest to the Metro Benchmark at the end of February. On the higher side, the Burnaby South Benchmark price was $1,682,600, an increase of 0.9 per cent over the previous month. North Vancouver’s Benchmark was $1686,800, an increase of 1.0 per cent over the previous month; and Richmond’s Benchmark was $1,697,900, an increase of 0.4 per cent over the previous month. On the lower side, the Vancouver East Benchmark was $1,560,400, a decrease of 0,2 per cent from the previous month; the Burnaby North Benchmark was $1,532,700, a decrease of 2.2 per cent from the previous month; and Port Moody’s Benchmark was $1,483,700, a decrease of 0.7 per cent from the preceding month.

Townhouses

The Benchmark price for a townhouse in Metro Vancouver at the end of February was $819,200. This average was made up of prices ranging from a high of $1,250,100 in Vancouver West to a low of $551,400 in Maple Ridge. I have again selected three areas on each side of the Benchmark which are closest to the Benchmark at the end of February. On the higher side, almost identical to the Metro Benchmark was the Richmond Benchmark at $819,500, a decrease of 0.4 per cent from the previous month. The Benchmark for Vancouver East was $868,900, an increase of 1.3 per cent from the previous month; and the North Vancouver Benchmark at $998,400, an increase of 0.7 per cent from the previous month. On the lower side, the Benchmark for Burnaby South was $807,600, an increase of 2.7 per cent over the previous month. The Tsawwassen Benchmark was $756,000, a decrease of 0.9 per cent from the previous month; and the Ladner Benchmark at $783,200, an increase of 0.9 per cent from the previous month. In this breakdown, I have excluded Whistler as I normally do for areas farther out than my clients wish to look.

Condominiums

The Metro Vancouver Benchmark price for condominiums at the end of February was $682,800. The extremities of this average ranged from a high in West Vancouver at $1,237,100 to a low in Maple Ridge of $307,800. Here is my selection of three areas closest on both sides of the Benchmark. On the higher side, the Benchmark for Burnaby East was $706,700, an increase of 2.6 per cent over the previous month. The Benchmark for Burnaby South was $710,100, an increase of 1.8 per cent over the preceding month; and Vancouver West’s Benchmark at $835,800 was an increase of 2.9 per cent over the previous month. On the lower side, the Benchmark for Port Moody was $668,300, an increase of 4.0 per cent over the previous month. Richmond’s Benchmark at $657,800 was an increase of 1.2 per cent over the previous month; and the Burnaby North Benchmark at $642,500 was an increase of 3.9 per cent over the previous month. These selections are made to guide my clients who are looking to purchase, or sell, one of these property types within the Metro Vancouver region based on the mid-range prices of comparable properties.

There are of course many properties in areas outside the mid-price range I have focused on in my selections above. If you would like to learn more about prices in any other areas of Greater Vancouver, I will be happy to help you find a property that fits your mortgage range. Please feel free to give me a call.

FRASER VALLEY

There was also a decrease – a small one — in the year-over-year number of February sales in the Fraser Valley, a mere 0.8 per cent decline. However, the Valley continues as a high demand area, noted by February’s 14.5 per cent increase over January 2018 sales activity. As has been the case for many months, attached properties – townhouses and condominiums – together represented more than half of all the transactions. Fraser Valley home seekers can again be buoyed with the fact that inventory in February increased 9.5 per cent over the preceding month, bringing the total supply of properties on the market at the end of February to 4,340.

For anyone thinking about listing their property for sale, it is nonetheless a good time because demand continues to be greater than the 10-year average for this time of year. During the month of February, detached properties took on an average of 38 days to sell, while townhouses sold after an average of 28 days, and condominiums on an average of 13 days. I highly recommend home purchases in the Fraser Valley at this time. Prices on average are still below those of comparable properties in Metro Vancouver. The composite Benchmark price for all property types in the Fraser Valley at the end of February was $795,100. For this reason, it is a favorite starting area for young families and singles often looking in the townhouse and condominium market segment. However, there is excellent value to be found in all housing types, and for families who want to start with a detached property, or perhaps move up to detached home from their existing townhouse, the Valley has very good prices. I will review the Benchmark prices for each property type in the space below and will make some recommendations on which areas you might wish to look for your preferred price range.

Detached Homes

The Benchmark price for a single family detached home in the Fraser Valley was $992,100 at the end of February, an increase of 1.0 per cent over the preceding month, and a 15.7 per cent increase year-over-year. Compared with the Metro Vancouver Benchmark of $1,602,000 for a comparable property, you can see why this is an attractive investment. The extremities of this average are not as far apart as Metro Vancouver areas, with South Surrey/White Rock at the high end at $1,482,800 and Mission at the low end at $663,500. Closest to the Valley Benchmark on the higher side at the end of February were: Cloverdale at $1,036,600, a 2.2 per cent increase over January; Langley at $1,028,200, a 0,4 per cent increase over January; and Surrey at $1,019,500, an increase of 0.6 per cent over January. Closest to the Valley Benchmark on the lower side were: North Surrey at $972,100, an increase of 0.6 per cent over January; North Delta at $944,800, an increase of 0.4 per cent over January; and Abbotsford at $803,300, an increase of 2.2 per cent over January.

Townhouses

The Benchmark price for townhouses in the Fraser Valley was $531,000 at the end of February. This average is from the extremities of $656,000 in South Surrey/White Rock and $371,600 in Abbotsford. Closest on the higher side of the Benchmark were: North Surrey at $560,200, an increase of 3.1 per cent over January; Surrey at $569,000, an increase of 2.1 per cent over January; and North Delta at $581,000, an increase of 0.4 per cent over January. Closest to the Benchmark on the lower side were: Langley at $508,500, an increase of 1.9 per cent over January; Abbotsford at $371,600 and increase of 2.7 per cent over January; and Mission at $433,400, an increase of 0.3 per cent over January.

Condominiums

The Benchmark price for condominiums in the Fraser Valley was $422,300 at the end of February. The extremities for this average were $519,00 in South Surrey White Rock and $315,400 in Mission. Closest to this Benchmark on the higher side were: Langley at $424,300, an increase of 4.3 per cent over January; Surrey at $427,400, an increase of 6.3 per cent over January; and Cloverdale at $488,100, an increase of 4.0 per cent over January. Closest on the lower side of the Benchmark price were: North Surrey at $410,400, an increase of 4.8 per cent over January; North Delta at $394,100, an increase of 4.8 per cent over January; and Abbotsford at $315,900, an increase of 5.3 per cent over January.

I selected the above areas to assist you in your search for a home to fit your mortgage capability. Keep in mind that the Benchmark prices are a comparison of comparable properties in their respective categories.

If there is any area that you would like to get more specific information on prices in any area, please feel free to call me. I keep a close eye on new listings and changes in prices, and I am always happy to help in any way I can.

Thanks for reading!

Sibo Zhang, REALTOR®


Your February Real Estate Recap for Metro Vancouver and the Fraser Valley

METRO VANCOUVER

As we move into the second month of 2018, average price levels across all property types continue to inch upwards, or remain the same as last month. However, it’s worth keeping in mind that even a modest price increase of less than 1.0 per cent can add several thousands of dollars to home when we are in a market where the composite benchmark price for all residential properties, based on last month’s closing figures of the Real Estate Board of Greater Vancouver, is $1,056,500. Since my January newsletter, when this same benchmark was $1,050,000, you can see the actual difference. So, once again, my general advice to anyone who needs to find a home before being outpriced, is not to delay because it’s likely you will pay more in the future for a similar property. That said, I am still continually scouring the market for any specific good buys for my clients that can get overlooked in a general average.

Some good news this month is that there were 3,796 new listings across all property types on the Multiple Listing Service for Metro Vancouver. This brings the total inventory of listed properties to 6,947, which provides a wide choice selection, although admittedly in a high demand market. Looking at the sales in each property type last month, we continue to see the greatest number was for condominiums with 57.2 percent, followed by townhouses with 32.8 per cent. Detached homes remained in the last place, as has been the trend for several months. Looking at the actual number of sales in each category last month, we can compare these figures with one year ago to see the underlying upward pressure on price levels now in place. Detached home sales in last month were 487, an increase of almost 10 per cent over January sales in 2017. The current benchmark price for detached properties in Metro Vancouver is $1,601,500, an increase of just over 8 per cent since January 2017. Condominium sales last month were 1,012, an increase of almost 23 per cent since January 2017. The current benchmark price for a condominium in Metro Vancouver is $665,400, an increase of slightly more than 27 per cent over January 2017. Townhouse sales last month were 319, almost 26 per cent higher than sales in January 2017. The benchmark price for a Metro Vancouver townhouse is currently $803,700, an increase of almost 18 per cent since January 2017. Although the correlation between the increase in sales and the increase in price here is a bit rough, there appears to be relationship between the monthly number of sales and the price increases that is somewhat in synch. You might want to use this a rule of thumb, though not a perfect one, for predicting future price increases in whatever property category you are searching. I will keep you informed of monthly sales and prices in each of my newsletters.

Detached Properties

There is quite a large difference between the extremes in prices for Single Family Detached homes across Metro Vancouver. Excluding areas such as Whistler and Sunshine Coast which are farther out than my clients are looking, here is the range of the prices that make up the benchmark price of $1,601,500. In West Vancouver and Vancouver West, the benchmark price is, respectively, $3,099,500, and $3,548,400. On the other end of the scale are Maple Ridge and Pitt Meadows, at, respectively, $833,600 and $904,600. Only Burnaby South, Richmond and North Vancouver are higher than the Metro Vancouver benchmark, while other municipalities are currently below. In each of the middle-priced municipalities, the prices are close to the Metro Benchmark. I will be happy to supply anyone looking to buy a detached property an exact benchmark for the desired area if you would like to contact me.

For the other property types, I have made the following area selections based on current price changes.

Townhouses

The benchmark price for townhouses in Metro Vancouver, excluding Whistler and Squamish, remained unchanged since the previous month’s figures at $665,400. The extremities of the average in January ranged from $1,247,900 in Vancouver West to $533,800 in Maple Ridge. Two municipalities showed a one month decrease: Vancouver East with a benchmark of $857,600 was a drop of 2.5 per cent from one month previous, and Ladner at $776,000 was a one month decrease of 0.1 per cent. Most of the other municipalities had small increases below 1.0 per cent. But there were three notable exceptions where the month-over-month benchmark price was somewhat higher: Burnaby South showed the biggest jump with a 2.8 per cent increase to $786,400; Richmond had one month increase of 1.8 per cent to $822,500; and Burnaby East increased 1.3 per cent to $667,900.

Condominiums

The benchmark price for condominiums in Metro Vancouver, excluding Whistler and Squamish, showed a 1.5 per cent increase over one month. The benchmark average had extremities of $1,179,400 in West Vancouver, which was a one month increase of 0.7 per cent; and $291,500 in Maple Ridge, a one month increase of 3.3 per cent. Notably, the one month increase in Maple Ridge was the highest across Metro Vancouver, followed by a 3.2 per cent increase in Pitt Meadows to $436,200. The third highest monthly increase was in Burnaby North at $618,400. It is worth observing that the largest monthly increases appear to be happening in the lower priced market segment. Since condominiums are often the entry level for residential property owners, I would recommend that this category of buyers, often singles or young couples, not delay in making a purchasing decision if your budget down payment and mortgage are already determined.

FRASER VALLEY

The Valley market showed one of the strongest January sales volumes ever, with 1,210 sales across all property types. This was a 24 per cent increase for January sales since 2017, and third highest January on record with the Fraser Valley Real Estate Board. The January benchmark price for a Fraser Valley Single Detached property $982,700, still under the $1-million mark and only a slight increase 0.6 per cent from the preceding month. Note that this was a over a 15 per cent increase year over year, which is a good reflection of the market activity in this region. The greatest sales activity, however, continues to be for townhouses and condominiums, which represented 51 per cent of all sales in January. Of the total number 1,210 of residential sales, 281 were townhouses, and 338 were condominiums. It is important to note that demand is outpacing supply in the Fraser Valley. While there were 2,092 new listings in January, which brought the total Valley inventory to 3,962, there continues to be an increasing number of potential buyers, so prices overall are moving upwards, although not with any alarming increases. I will be happy to show provide specific and current benchmark prices for single detached properties to anyone shopping in the that category, but with most Fraser Valley clients looking for the other two property types I will focus on these segments here.

Townhouses

The January benchmark price for a Valley townhouse was $519,400, a 1.2 per cent increase from the preceding month. Again, I point out that this price level is a year over increase of 23.4 per cent so it is important keep in mind that delayed purchasing decisions in this current market can be costly. The current benchmark average price has relatively narrow extremities ranging from a high in South Surrey/White Rock at $664,200 to a low of $361,800 in Abbotsford. Interestingly, the South Surrey/White Rock price is a 0.5 per cent decrease from the preceding month. All other municipalities show modest month-over-month increases. The areas with the three largest month-over-month benchmark price percentage increases were: Mission at $432,000, an increase of 3.7 per cent; Langley and North Surrey both had monthly increases of 1.9 per cent, bringing their prices, respectively, to $499,200 and $543,400; and Abbotsford, at $361,800, a monthly increase of 1.7 per cent.

Condominiums

The January benchmark price for a condominium in the Fraser Valley was $404,100, a month-over-month increase of 4.0 per cent. The extremities of this average range from $507,400 in South Surrey/White Rock, an increase of 4.0 per cent from the preceding month to $300,100 in Abbotsford, an increase of 4.7 per cent from the preceding month. The three municipalities with the biggest month-over-month increase in this segment’s benchmark price were Surrey, with an increase of 5.2 per cent bringing its January benchmark to 402,000; Abbotsford, with an increase of 4.7 per cent bringing its January benchmark to $300,100; and Cloverdale, with an increase of 4.6 per cent, for a January benchmark of $469,300. Again, I would draw attention to larger percentage increases often occurring in the lower end of the market prices. For entry level buyers, I would advise if you are looking for condominium to get started, that you don’t delay too long as prices are moving up in this market segment.

If any of my newsletter readers would like a personal and confidential consultation on your home requirements, I would be very happy to advise you. I have experience in both finance and Real Estate, and pay close attention to the market.

Please feel free to give me a call. I am here to help!

Thanks for reading!

Sibo Zhang, REALTOR®

Rainy Days By The Numbers

Rainy days by the numbers In case you haven’t noticed, it’s been raining a lot lately! That’s not a surprise in Vancouver. We’re used to long stretches of rain (and sometimes some snow) from around November to April each year. About this time every year, those warm sunny beach holidays in another country start looking very enticing.

Yet, according to measurements in Vancouver last year, it was March that had the most precipitation with 199.4 millimetres. It wasn’t until November that we got close to that again with 194.8 millimetres. It was newsworthy when November 2017 was recognized for its 27 days of rain out of 30 days, which tied it for the most days of rain in any month since 1953. The summer months were quite low in contrast. June had 46.4 millimetres and then the rain dropped dramatically in July and August to 1.8 millimetres and 5.0 millimetres respectively. Back to the present, however, this January has been very rainy, As of January 19, this month’s precipitation, measured at the sea level in Vancouver’s Coal Harbour, was already at 115.4 millimetres, significantly higher than all of January 2017 at 98.8 millimetres.

You may be someone who thinks about the number of rainy days rather than the amount of rain that actually fell. In that case, here’s a tabulation of the number of days in 2017 with rain fall over four different thresholds.

It’s noteworthy, though not surprising, that the greatest number of rainy days are those above 0.2 millimetres. This is evidence that our sense of that long stretch of rainy days from November to April is correct, but we should also note that the amount of actual rain each day is typically quite low. And the number of really heavy rain days is also quite low.

I think many people will find this to be counter-intuitive – especially this year, when it seems like almost every day is one of heavy rainfall. Perhaps this is a good reason to remind ourselves that our perceptions of rain can be emotionally influenced. So, it worthwhile to check the actual statistics occasionally. It’s a good reality check.

Over the past 25 years, annual precipitation in Vancouver has almost always exceeded 1,000 millimetres. Data collected by Environment and Climate Change Canada show only three years below that amount: 1993 with 837.0 millimetres; 2002 with 857.6 millimetres; and 2013 with 944.0 millimetres. It’s interesting that the lower volumes are increasing as we go forward, but is it a trend? Something to watch I think. For the years above 1,000 millimetres, the precipitation volume in 2016 was the highest at 1,356.8 millimetres. Close behind that was 2007 with 1,322.4 millimetres; 2014 had 1,276.3 millimetres and 2017 had 1,239.3 millimetres. There are a lot of ways to measure rain.

These statistics from Environment and Climate Change Canada are a great way to slice and dice the weather. As I have often mentioned, I like to analyze things statistically, but sometimes it’s also good just to use your basic intuition. For example, I was not able to find any statistics that correlated the amount of rain with a wind factor. With this correlation I think we could also develop a rain wetness index that is similar to what is called a chill factor. Meteorologists have devised the chill factor to indicate how cold it “feels” when you combine the wind and the temperature. So why not a rain wetness factor that would indicate how wet you get when the rain is blowing on you? For example, a heavy downpour in a 40-kilometre per hour wind might be the same rain wetness factor as light rain in an 80-kilometre per hour wind storm. Imagine the calculations you could do! Maybe that will help keep your mind off the rain.

I send you warm and cheery wishes during these rainy and grey winter days.

Thanks for reading!

Sibo Zhang, REALTOR®