Rainy days by the numbers In case you haven’t noticed, it’s been raining a lot lately! That’s not a surprise in Vancouver. We’re used to long stretches of rain (and sometimes some snow) from around November to April each year. About this time every year, those warm sunny beach holidays in another country start looking very enticing.
Yet, according to measurements in Vancouver last year, it was March that had the most precipitation with 199.4 millimetres. It wasn’t until November that we got close to that again with 194.8 millimetres. It was newsworthy when November 2017 was recognized for its 27 days of rain out of 30 days, which tied it for the most days of rain in any month since 1953. The summer months were quite low in contrast. June had 46.4 millimetres and then the rain dropped dramatically in July and August to 1.8 millimetres and 5.0 millimetres respectively. Back to the present, however, this January has been very rainy, As of January 19, this month’s precipitation, measured at the sea level in Vancouver’s Coal Harbour, was already at 115.4 millimetres, significantly higher than all of January 2017 at 98.8 millimetres.
You may be someone who thinks about the number of rainy days rather than the amount of rain that actually fell. In that case, here’s a tabulation of the number of days in 2017 with rain fall over four different thresholds.
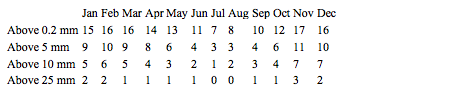
It’s noteworthy, though not surprising, that the greatest number of rainy days are those above 0.2 millimetres. This is evidence that our sense of that long stretch of rainy days from November to April is correct, but we should also note that the amount of actual rain each day is typically quite low. And the number of really heavy rain days is also quite low.
I think many people will find this to be counter-intuitive – especially this year, when it seems like almost every day is one of heavy rainfall. Perhaps this is a good reason to remind ourselves that our perceptions of rain can be emotionally influenced. So, it worthwhile to check the actual statistics occasionally. It’s a good reality check.
Over the past 25 years, annual precipitation in Vancouver has almost always exceeded 1,000 millimetres. Data collected by Environment and Climate Change Canada show only three years below that amount: 1993 with 837.0 millimetres; 2002 with 857.6 millimetres; and 2013 with 944.0 millimetres. It’s interesting that the lower volumes are increasing as we go forward, but is it a trend? Something to watch I think. For the years above 1,000 millimetres, the precipitation volume in 2016 was the highest at 1,356.8 millimetres. Close behind that was 2007 with 1,322.4 millimetres; 2014 had 1,276.3 millimetres and 2017 had 1,239.3 millimetres. There are a lot of ways to measure rain.
These statistics from Environment and Climate Change Canada are a great way to slice and dice the weather. As I have often mentioned, I like to analyze things statistically, but sometimes it’s also good just to use your basic intuition. For example, I was not able to find any statistics that correlated the amount of rain with a wind factor. With this correlation I think we could also develop a rain wetness index that is similar to what is called a chill factor. Meteorologists have devised the chill factor to indicate how cold it “feels” when you combine the wind and the temperature. So why not a rain wetness factor that would indicate how wet you get when the rain is blowing on you? For example, a heavy downpour in a 40-kilometre per hour wind might be the same rain wetness factor as light rain in an 80-kilometre per hour wind storm. Imagine the calculations you could do! Maybe that will help keep your mind off the rain.
I send you warm and cheery wishes during these rainy and grey winter days.
Thanks for reading!
Sibo Zhang, REALTOR®