surrey condos for sale

Sales move up while new listings drop; composite residential benchmark still below $1-million

There are several market dynamics occurring at this time which reinforce what I have been saying for the last couple of months. If you are watching the housing market with the intention of buying, then I highly recommend you make that decision now. July sales in the Greater Vancouver region showed a sharp rise over June, an increase of more than 23 per cent in one month. I would normally not pay the as much attention to one month’s activity except that July is typically a slower month for real estate sales. Add to this current activity two other metrics to see what’s emerging. First, the number of new listings in July went down almost 5.0 per cent compared with June; and second, the composite benchmark price is just under the psychological threshold of $1-million. Together, these three figures suggest that buyers are realizing prices could begin rising against a declining inventory, and that once the $1-million mark is surpassed again, pent up demand can keep it going upwards. This can also cause potential sellers to delay their listing while hoping to get a higher price, which further move prices up on supply -demand basis.

In actual numbers, there is still a sizable inventory across all housing types so the selection remains very good with a total 14,240 homes available at the end of July. You can find a sample of benchmarks for each property type below with my latest comparisons of month-over-month prices. The composite benchmark price for Metro Vancouver at the end of July was $995,200, a slight decrease of 0.2 per cent from June. As I mentioned last month, this benchmark dropped below $1-million for the first time since 2017, brought down by market cooling measures taken by two levels of government. During this time, a lot of potential buyers have been waiting on the sidelines to make a purchase. As it did in 2017, this benchmark price jumped over $1-million quickly. I will be watching it for you in this newsletter next month. In the meantime, I encourage you to take advantage of the lovely summer weather and check out some of the great listings available to you now.

Detached Homes

The benchmark price for a single-family detached home in Greater Vancouver at the end of July was $1,417,000, a decrease of 0.5 per cent from the preceding month. The extremities of this average were Vancouver West (not West Vancouver) at $2,885,400 and Sunshine Coast at $596,300. (Note I include the Sunshine Coast only as a factor in the average, but do not report on housing prices in this area because it is to far away for my clients). The three municipalities closest to the benchmark on the higher side of the average were: Port Moody at $1,442,000, an increase of 1.0 per cent from the preceding month; Richmond at $1,474,800, a decrease of 0.7 per cent from the preceding month; and Burnaby South at $1,477,300, a decrease of 1.3 per cent from the preceding month. The three municipalities closest to the benchmark on the lower side of the average were: Burnaby North at $1,373,400, a decrease of 1.9 per cent from the preceding month; Vancouver East at $1,352,800, an increase of 0.2 per cent from the preceding month; and Burnaby East at $1,181,900, and increase of 0.1 per cent from the preceding month.

Townhouses

The benchmark price for a townhouse in Greater Vancouver at the end of July was $770,000, a decrease of 0.6 per cent from the preceding month. The extremities of this average were Vancouver West (not West Vancouver) at $1,114,700 and Maple Ridge at $524,100. The three municipalities closest to the benchmark on the higher side of the average were: Richmond at $770,900, a decrease of 1.1 per cent from the preceding month; Vancouver East at $847,400, a decrease of 1.6 per cent from the preceding month; and West Vancouver at $1,114,700, a decrease of 1.0 per cent from the preceding month. (Note I have excluded Whistler in third place here because it is too far away for my clients.) The three municipalities closest to the benchmark on the lower side of the average were: Burnaby South at $760,600, a decrease of 0.3 per cent from the preceding month; New Westminster at $713,900, a decrease of 1.1 per cent from the preceding month; and Port Moody at $656,900, an increase of 0.4 per cent from the preceding month. (Note I have excluded Squamish in third place here because it is too far away for my clients.)

Condominiums

The benchmark price for a condominium in Greater Vancouver at the end of July was $653,200, a decrease of 0.2 per cent from the preceding month. The extremities of the average were West Vancouver at $1,085,700 and Maple Ridge at $347,800. The three municipalities closest to the benchmark on the higher side of the average were: Burnaby South at $653,500, a decrease of 1.9 per cent from the preceding month; Burnaby East at $721,200, a decrease of 2.0 per cent from the preceding month; and Vancouver West (not West Vancouver) at $752,300, an increase of 1.1 per cent from the preceding month. The three municipalities closest to the benchmark on the lower side of the average were: Port Moody at 628,700, an increase of 1.4 per cent from the preceding month; Richmond at $652,500, a decrease of 1.0 per cent from the preceding month; and Burnaby North at $609,500, an increase of 0.3 per cent from the preceding month.

How can I help?

I am here to help you, whatever your housing requirements, I bring experience in banking and finance to assist you in your mortgage planning and can also advise you on pricing your home at the optimal price for the prevailing market conditions. This may include renovations that will increase your home value or simply enhance your own living comfort. I can recommend excellent tradespeople who are reputable, reliable and reasonable in their rates. It gives me pleasure to help my clients. Please don’t hesitate to call me for any real estate advice you may need.

Thanks for reading!

Sibo Zhang, REALTOR®

Declining Prices Continue Into the New Year

A new year is upon us, and I welcome you back from the holiday season just past.

Everyone is wondering of course, what the residential market will do in the year ahead of us. It’s natural to want to gaze into the proverbial crystal ball to predict the future. And while I’m afraid I don’t have such a fortune telling device, I can advise you on the trend that is continuing from the end of last year.

In general, average home prices (benchmarks) are showing slight declines each month, although there are still minor upticks here and there, which is normal in any active market. Looking back at 2018 we can see the skyrocketing prices that had been occurring since 2016 suddenly peaked at the end of June last year. They have been declining in small increments each month since. We can safely surmise that this dramatic reversal resulted from government measures to cool the market: provincial foreign ownership and speculation taxes combined with new federal rules for stricter mortgage qualification.

Add to all this, higher variable mortgage rates pushed up by Canada’s central bank’s rising interest rates and it’s easy to see why prices are dropping. In the last six months of 2018, the cumulative decline was 6.5 per cent.

Forecasts and current trends

The first thing I will say about this trend is that there is no reason to think it will not continue into the near future. But exactly how long is anybody’s guess. I want to be very upfront with you about this. I will not tell anyone to list or buy at a specific time based solely on market statistics for two reasons: First, even an educated guess is still a guess, and two (more importantly), there are many personal and individual factors that need to be taken into consideration in such an important transaction. What I am able to do for my clients during a period of indecision is to help them evaluate what their needs are, both financial and for living accommodations, and how to develop a sound strategic plan based on their individual circumstances. This may be something like setting a threshold or target price to wait for, or a preparing a comparative market analysis on a property you are considering at the present time. I have also been able to assist clients in deciding on renovations that will help to maximize their value when they decide to sell; or to help prospective buyers with the features they want for their individual tastes.

Newsletter in 2019

I will continue to provide a monthly snapshot of benchmark prices for all property types across the Lower Mainland based on the latest statistics. I know readers like to watch these monthly changes in average prices. The cooling market has shifted from a sellers’ market to a buyers’ market since July last year, meaning that buyers don’t have to make offers frantically, as they did when the prices were soaring. A couple of statistics that I will include in this new environment are one-year and ten-year comparisons so you can get some idea of what the current benchmarks mean during this current period.

Combined Benchmark

The combined benchmark for all property types in Metro Vancouver at the end of December 2018 was $1.032,400, a decrease 2.7 per cent decrease from one year earlier, and a 0.9 decrease from the preceding month. This benchmark price is 102.5 per cent higher than 10 years ago. In the Fraser Valley the combined benchmark for all property types at the end of 2018 was $834,700, an increase of 2.5 per cent from one year earlier and a 0.8 per cent decline from the previous month. This benchmark price is 97.0 per cent higher than 10 years ago.

METRO VANCOUVER BENCHMARKS

Detached Homes

The benchmark price for a single family detached home in Metro Vancouver at end of December 2018 was $1,479,7000, a decrease of 1.4 per cent from the preceding month. The extremities of this average were Vancouver West (not West Vancouver) at $3,138,400 and the Sunshine Coast at $613,700. (Note I include the region only as a factor in the average, but I do not report on housing prices in this area because it is to far away for my clients). The three municipalities with benchmarks closest on the higher side of the average were: Port Moody at $1,485,300, a decrease of 0.9 per cent from the preceding month; North Vancouver at $1,569,800, a decrease of 2.6 per cent from the preceding month; and Burnaby South at $1,569,800, a decline of 2.6 per cent from the preceding month. The three municipalities closest to the benchmark on the lower side of the average were: Burnaby North at $1,448,900, a decrease of 1.4 per cent from the preceding month; Vancouver East at $1,447,300, a decrease of 1.6 per cent from the preceding month; and Coquitlam at $1,214,300, a decrease of 1.3 per cent from the preceding month.

Townhouses

The benchmark price for a townhouse in Metro Vancouver at the end of December 2018 was $809,700, a decrease of 1.1 per cent from the preceding month. The extremities of the average were Vancouver West (not West Vancouver) at $1,140,900 and Maple Ridge at $360,800. The three municipalities closest on the higher side of this average were: Richmond at $819,800, a decrease of 2.4 per cent from the preceding month; Vancouver East $850,000, an increase of 2.3 per cent from the preceding month; and North Vancouver at $994,300, a decrease of 2.0 per cent from the preceding month. The three municipalities closest on the lower side of this average were: Burnaby South at $790,800, a decrease of 0.9 per cent from the preceding month; Ladner at $760,500, a decrease of 1.2 per cent from the preceding month; and Tsawwassen at $748,800, an increase of 1.3 per cent from the preceding month.

Condominiums

The benchmark price for condominium in Metro Vancouver at the end of December 2018 was $664,100, a decrease of 0.6 per cent from the previous month. The extremities of the average were West Vancouver at $1,140,900 and Maple Ridge at $360,800. The three municipalities closest on the higher side of this average were: Richmond at $668,500, an increase of 1.5 per cent from the preceding month; Burnaby South at $685,700, a decrease of 0.6 per cent from the preceding month; and Burnaby East at $770,300, an increase of 1.0 per cent from the preceding month. The three municipalities closest on the lower side of this average were: Port Moody at $627,300, a decrease of 2.9 per cent from the preceding month; Burnaby North at $619,100, a decrease of 2.1 per cent from the preceding month; and North Vancouver at $567,300, a decrease of 1.2 per cent from the preceding month.

FRASER VALLEY BENCHMARKS

Detached Homes

The benchmark price for a detached home in the Fraser Valley at the end of December was $965,300, a decrease of 1.1 per cent from the previous month. The extremities of this average were South Surrey/White Rock at $674,100 and Mission at $651,900. The three municipalities closest on the higher side of this average were North Surrey at $973,500, a decrease of 0.6 per cent from the preceding month; Cloverdale at $982,200, an increase of 0.1 per cent from the preceding month; and Langley at $1,003,000, a decrease of 0.6 per cent from the preceding month. The three municipalities closest on the lower side of this average were: North Delta at $887,800, a decrease of 2.8 per cent from the preceding month; Abbotsford at $792,600, a decrease of 1.3 per cent from the preceding month; and Mission at $651,900, a decrease of 0.4 per cent from the preceding month.

Townhouses

The benchmark price for a townhouse in the Fraser Valley at the end of December was $531,900, a decrease of 0.2 per cent from the preceding month. The extremities of this average were South Surrey/White Rock at $572,100 and Abbotsford at $314,000. The three municipalities closest on the higher side of this average were: Cloverdale at $550,400, a decrease of 0.9 per cent from the preceding month; North Surrey at $577,600, a decrease of 1.9 per cent from the preceding month; and Surrey at $581,000, an increase of 0.5 per cent from the preceding month. The three municipalities closest on the lower side of this average were: Langley at $494,700, a decrease of 0.4 per cent from the preceding month; Mission at $455,900, an increase of 2.7 per cent from the preceding month; and Abbotsford at $383,400, a decrease of 2.1 per cent from the preceding month.

Condominiums

The benchmark price for a condominium in the Fraser Valley at the end of December was $418,300, a decrease of 1.0 per cent from the preceding month. The extremities of this average were South Surrey/White Rock at $500,100 and Abbotsford at $314,000. The three municipalities closest on the higher side of this average were: Surrey at $428,200, a decrease of 0.9 per cent from the preceding month; Cloverdale at $468,100, a decrease of 0.7 per cent from the preceding month; and South Surrey/ White Rock at $500,100, a decrease of 1.2 per cent from the preceding month. The three municipalities closest on the lower side of this average were: Langley at $413,100, a decrease of 0.9 per cent from the preceding month; North Surrey at $409,600, a decrease of 1.0 per cent from the preceding month; and North Delta at $400,000, a decrease of 0.8 per cent from the preceding month.

QUESTIONS? PLEASE LET ME KNOW

Please remember, I make my family home in Surrey and we are proud to see our city grow with the neighbourhood amenities that make for a wonderful life here. I am here to help with whatever your real estate needs may be. As a consistently recognized top-tier realtor, and with experience in finance, banking and real estate sales, I am happy to advise you, without pressure, so you can make a choice that will lead to your long-term happiness. Please let me know if I can help.

With my wife and two children, we wish you the very best for 2019.

Your March Market Update for Metro Vancouver and the Fraser Valley

If you happened to read the news story in the Globe and Mail at the beginning of the month, the headline surely intrigued you: “Vancouver housing sales fall 9 % in February.” The story behind the decline is really the more important consideration for prospective home buyers. As a statistician, I always want my clients to understand the reason when a number is cited.

First, the February sales decline is for all property types across Metro Vancouver, so we will have to look more closely at the different categories. Based on ten-year sales average, February’s sales for all property types were down 14.4 per cent; detached sales declined 39.4 per cent; townhouse declined 6.8 per cent, but condominium sales rose 5.5 per cent above the 10-year average. Second, the 9 per cent decrease is a comparison with February sales in 2017. It’s a significant percentage, but the actual number of sales for the respective months were 2,207 in 2018 and 2,424 in 2017, so in practical terms not really a huge difference. And the number of sales in February this year was a monthly increase of 21.4 per cent over January, so it’s important to recognize that the market is still very active. The composite benchmark price for all residential properties in Metro Vancouver at the end of February was $1,071.800, a 16.9 per cent increase year-over-year and a 1.4 per cent increase since January this year. It will be important to watch these two price levels in coming months.

What the newspaper story was really about what may be the beginning of fewer sales each month following the provincial budget announcements in February that impact out-of-province buyers. The BC government has targeted speculative buyers with an additional tax as well as increasing and expanding the foreign buyers tax beyond Metro Vancouver. I will talk more about these tax measures in my next Blog, but for now I will focus on the market place prices for prospective local home buyers and sellers.

Detached Properties

The benchmark price for a single detached property in Greater Vancouver at the end of February was $1,602,000, an 8.2 per cent increase from the February 2017, and a 1.9 per cent increase from January this year. The extremities of this average range from a high in Vancouver West (higher than West Vancouver, and excluding Whistler) at $3,500,600 to a low in low in Maple Ridge at $847,700. That’s obviously quite a large spread, so I’ve selected three areas on each side of the Benchmark where you can find properties closest to the Metro Benchmark at the end of February. On the higher side, the Burnaby South Benchmark price was $1,682,600, an increase of 0.9 per cent over the previous month. North Vancouver’s Benchmark was $1686,800, an increase of 1.0 per cent over the previous month; and Richmond’s Benchmark was $1,697,900, an increase of 0.4 per cent over the previous month. On the lower side, the Vancouver East Benchmark was $1,560,400, a decrease of 0,2 per cent from the previous month; the Burnaby North Benchmark was $1,532,700, a decrease of 2.2 per cent from the previous month; and Port Moody’s Benchmark was $1,483,700, a decrease of 0.7 per cent from the preceding month.

Townhouses

The Benchmark price for a townhouse in Metro Vancouver at the end of February was $819,200. This average was made up of prices ranging from a high of $1,250,100 in Vancouver West to a low of $551,400 in Maple Ridge. I have again selected three areas on each side of the Benchmark which are closest to the Benchmark at the end of February. On the higher side, almost identical to the Metro Benchmark was the Richmond Benchmark at $819,500, a decrease of 0.4 per cent from the previous month. The Benchmark for Vancouver East was $868,900, an increase of 1.3 per cent from the previous month; and the North Vancouver Benchmark at $998,400, an increase of 0.7 per cent from the previous month. On the lower side, the Benchmark for Burnaby South was $807,600, an increase of 2.7 per cent over the previous month. The Tsawwassen Benchmark was $756,000, a decrease of 0.9 per cent from the previous month; and the Ladner Benchmark at $783,200, an increase of 0.9 per cent from the previous month. In this breakdown, I have excluded Whistler as I normally do for areas farther out than my clients wish to look.

Condominiums

The Metro Vancouver Benchmark price for condominiums at the end of February was $682,800. The extremities of this average ranged from a high in West Vancouver at $1,237,100 to a low in Maple Ridge of $307,800. Here is my selection of three areas closest on both sides of the Benchmark. On the higher side, the Benchmark for Burnaby East was $706,700, an increase of 2.6 per cent over the previous month. The Benchmark for Burnaby South was $710,100, an increase of 1.8 per cent over the preceding month; and Vancouver West’s Benchmark at $835,800 was an increase of 2.9 per cent over the previous month. On the lower side, the Benchmark for Port Moody was $668,300, an increase of 4.0 per cent over the previous month. Richmond’s Benchmark at $657,800 was an increase of 1.2 per cent over the previous month; and the Burnaby North Benchmark at $642,500 was an increase of 3.9 per cent over the previous month. These selections are made to guide my clients who are looking to purchase, or sell, one of these property types within the Metro Vancouver region based on the mid-range prices of comparable properties.

There are of course many properties in areas outside the mid-price range I have focused on in my selections above. If you would like to learn more about prices in any other areas of Greater Vancouver, I will be happy to help you find a property that fits your mortgage range. Please feel free to give me a call.

FRASER VALLEY

There was also a decrease – a small one — in the year-over-year number of February sales in the Fraser Valley, a mere 0.8 per cent decline. However, the Valley continues as a high demand area, noted by February’s 14.5 per cent increase over January 2018 sales activity. As has been the case for many months, attached properties – townhouses and condominiums – together represented more than half of all the transactions. Fraser Valley home seekers can again be buoyed with the fact that inventory in February increased 9.5 per cent over the preceding month, bringing the total supply of properties on the market at the end of February to 4,340.

For anyone thinking about listing their property for sale, it is nonetheless a good time because demand continues to be greater than the 10-year average for this time of year. During the month of February, detached properties took on an average of 38 days to sell, while townhouses sold after an average of 28 days, and condominiums on an average of 13 days. I highly recommend home purchases in the Fraser Valley at this time. Prices on average are still below those of comparable properties in Metro Vancouver. The composite Benchmark price for all property types in the Fraser Valley at the end of February was $795,100. For this reason, it is a favorite starting area for young families and singles often looking in the townhouse and condominium market segment. However, there is excellent value to be found in all housing types, and for families who want to start with a detached property, or perhaps move up to detached home from their existing townhouse, the Valley has very good prices. I will review the Benchmark prices for each property type in the space below and will make some recommendations on which areas you might wish to look for your preferred price range.

Detached Homes

The Benchmark price for a single family detached home in the Fraser Valley was $992,100 at the end of February, an increase of 1.0 per cent over the preceding month, and a 15.7 per cent increase year-over-year. Compared with the Metro Vancouver Benchmark of $1,602,000 for a comparable property, you can see why this is an attractive investment. The extremities of this average are not as far apart as Metro Vancouver areas, with South Surrey/White Rock at the high end at $1,482,800 and Mission at the low end at $663,500. Closest to the Valley Benchmark on the higher side at the end of February were: Cloverdale at $1,036,600, a 2.2 per cent increase over January; Langley at $1,028,200, a 0,4 per cent increase over January; and Surrey at $1,019,500, an increase of 0.6 per cent over January. Closest to the Valley Benchmark on the lower side were: North Surrey at $972,100, an increase of 0.6 per cent over January; North Delta at $944,800, an increase of 0.4 per cent over January; and Abbotsford at $803,300, an increase of 2.2 per cent over January.

Townhouses

The Benchmark price for townhouses in the Fraser Valley was $531,000 at the end of February. This average is from the extremities of $656,000 in South Surrey/White Rock and $371,600 in Abbotsford. Closest on the higher side of the Benchmark were: North Surrey at $560,200, an increase of 3.1 per cent over January; Surrey at $569,000, an increase of 2.1 per cent over January; and North Delta at $581,000, an increase of 0.4 per cent over January. Closest to the Benchmark on the lower side were: Langley at $508,500, an increase of 1.9 per cent over January; Abbotsford at $371,600 and increase of 2.7 per cent over January; and Mission at $433,400, an increase of 0.3 per cent over January.

Condominiums

The Benchmark price for condominiums in the Fraser Valley was $422,300 at the end of February. The extremities for this average were $519,00 in South Surrey White Rock and $315,400 in Mission. Closest to this Benchmark on the higher side were: Langley at $424,300, an increase of 4.3 per cent over January; Surrey at $427,400, an increase of 6.3 per cent over January; and Cloverdale at $488,100, an increase of 4.0 per cent over January. Closest on the lower side of the Benchmark price were: North Surrey at $410,400, an increase of 4.8 per cent over January; North Delta at $394,100, an increase of 4.8 per cent over January; and Abbotsford at $315,900, an increase of 5.3 per cent over January.

I selected the above areas to assist you in your search for a home to fit your mortgage capability. Keep in mind that the Benchmark prices are a comparison of comparable properties in their respective categories.

If there is any area that you would like to get more specific information on prices in any area, please feel free to call me. I keep a close eye on new listings and changes in prices, and I am always happy to help in any way I can.

Thanks for reading!

Sibo Zhang, REALTOR®
 

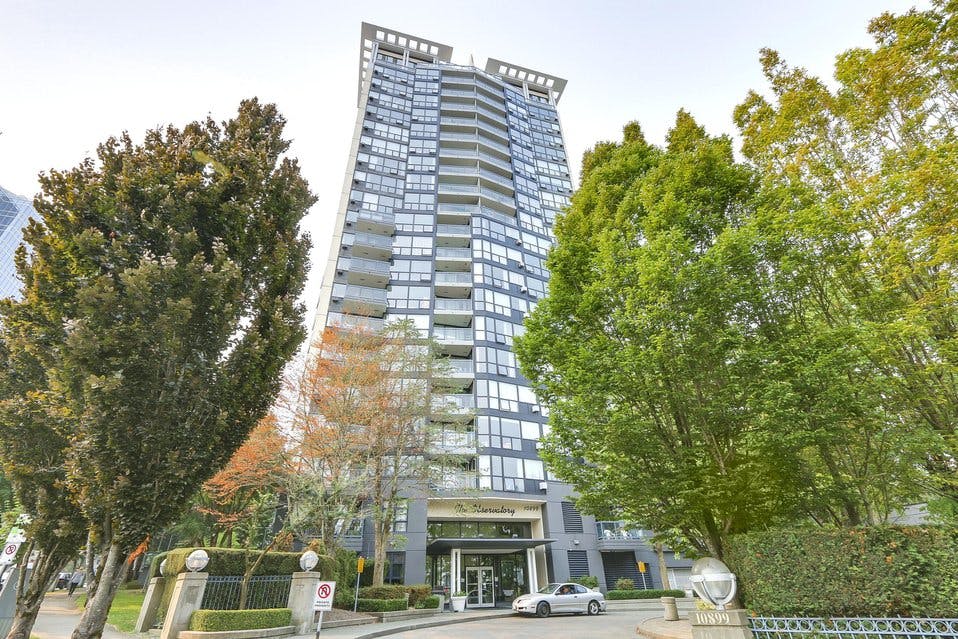
Coming Soon! HUGE 1 bedroom in the Observatory!

#606 – 10899 University Drive, Surrey BC

Coming soon to MLS! Welcome to the Observatory – Surrey’s concrete high-rise 1 block from the Gateway Skytrain. This HUGE, North-East facing 1 bedroom unit boasts mountain, river, AND city views! Everything you need within steps – access Downtown Vancouver in less than 40 mins, steps to Chuck Bailey Recreation Centre and Whalley Athletic Park, and shopping centre to be completed right beside Gateway Sky Train Station. Facilities include exercise room, sauna and hot tub.

Listed at $269,900. Bring your offer today. This deal will not last long!

Open House Saturday Aug. 19 and Sunday Aug. 20 2-4PM

Call Sibo with your questions: (604) 779-7992