
Spring has arrived and already there’s a noticeable increase in home shoppers actively engaged in visiting open houses across Metro Vancouver.
Continue reading →fraser valley market update

A great supply of home listings for affordable spring shopping
If you’ve been waiting for sunnier weather to start home hunting this spring, the month of May has not disappointed – nor has the abundant inventory of listed properties which increased by 16 per cent In April. Figures for the Greater Vancouver area showed there were over 5,700 new listings last month, bringing the total inventory for all housing types to 14,357. This is very close to the total inventory one year ago, putting prospective buyers in a very commanding position to make an offer at this time. Prices on average, having dropped considerably since last summer, are now in an affordable range for more people. We could therefore see a spike in spring sales, so I encourage you to take a look now. Residential home sales in the region last month increased by nearly 6.0 per cent from the month before, and I see no reason why this upward swing will not continue at this time.
There continues to be a focus by news media on the declining number of home sales based on figures from ten years ago. This may make interesting reading for the political interest in government measures behind the price drop in the region. However, I want to point out that what is overlooked in much of this long-term discourse is the short-term activity which holds some important data for anyone in actual purchase mode right now. The increase in month-over-month sales is one indicator that there is still upward price pressure in the market. Note that composite benchmark price for all residential properties in Metro Vancouver was virtually unchanged (0.3 per cent decrease) from March to April. In the specific property types below, I report my selected monthly changes based on benchmark prices for the end of April. But you may be surprised to note that not all areas show a decline. Look for example at the one-month condominium price increases in Burnaby East of 4.5 per cent and 1.5 per cent in Burnaby North. As prices decline some places, they increase in others.
Detached Homes
The benchmark price for a single-family detached home in Greater Vancouver at the end of April was $1,425,200, a decrease of 0.8 per cent from the preceding month. The extremities of this average were Vancouver West (not West Vancouver) at $2,948,400 and Sunshine Coast at $611,400. (Note I include the Sunshine Coast only as a factor in the average, but do not report on housing prices in this area because it is to far away for my clients). The three municipalities closest to the benchmark on the higher side of the average were: North Vancouver at $1,499,400, a decrease of 0.2 per cent from the preceding month; Richmond at $1,531,000, a decrease of 1.0 per cent from the preceding month; and Burnaby South at $1,532,100, a decrease of 0.8 per cent from the preceding month. The three municipalities closest to the benchmark on the lower side of the average were: Burnaby North at $1,391,000, a decrease of 1.5 per cent from the preceding month; Port Moody at $1,366,200, a decrease of 2.6 per cent from the preceding month; and Vancouver East at $1,357,200, a decrease of 2.4 per cent from the preceding month.
Townhouses
The benchmark price for a townhouse in Greater Vancouver at the end of April was $783,300, no change cent from the preceding month. The extremities of this average were Vancouver West (not West Vancouver) at $1,167,700 and Maple Ridge at $542,600. The three municipalities closest to the benchmark on the higher side of the average were: Vancouver East at $816,500, a decrease of 0.6 per cent from the preceding month; North Vancouver at $957,700, a decrease of 0.5 per cent from the preceding month; and Vancouver West at $1,167,700, a decrease of 1.4 per cent from the preceding month. The three municipalities closest to the benchmark on the lower side of the average were: Richmond at $780,200, a decrease of 1.4 per cent from the preceding month; Burnaby South at $679,200, a decrease of 1.3 per cent from the preceding month; and Burnaby North at $708,900, a decrease of 2.4 percent from the preceding month.
Condominiums
The benchmark price for a condominium in Greater Vancouver at the end of April was $656,900, no change from the preceding month. The extremities of this average were West Vancouver at $1,128,500 and Maple Ridge at $348,600. The three municipalities closest to the benchmark on the higher side of the average were: Burnaby South at $679,200, a decrease of 0.3 per cent from the preceding month; Burnaby East at $754,900 an increase of 4.5 per cent from the preceding month; and Vancouver West (not West Vancouver) at $764.600, a decrease of 0.6 per cent from the preceding month. The three municipalities closest to the benchmark on the lower side of the average were: Richmond at $654,900, a decrease of 0.2 per cent from the preceding month; Port Moody at $633,000, a decrease of 0.3 per cent from the preceding month; and Burnaby North at $611,800, an increase of 1.5 per cent from the preceding month.
How Can I Help?
Please let me know how I can help you. There are many factors in your decision-making process that I am qualified to advise on. Whether you are wondering about mortgage planning and finance procedures, or desiring information on a specific property or area, I can help. If you considering listing your property for sale, I am able to advise you on the optimal price and provide you with a detailed market comparison to other properties in your area of interest. And remember, I can recommend reputable and quality tradespeople if you are considering home renovations. It gives me great pleasure when I can assist my clients in any way.
Thanks for reading!
Please contact me for more information.
604-779-7992
sibo.zhang@gmail.com
Sibo Zhang

Notable Price Drops, New Listings Jump Dramatically in January
With the first month of the year behind us, I want to point out something interesting that typically happens during the month of January. I call it a belated Christmas present to home buyers. I have noticed that home sellers tend to drop their asking price at this time of year and current market data appear to support this. As you scan the sample benchmark price comparisons below, you can see some higher than usual price declines from the previous months. Where we have been seeing one-month price declines typically around 1.0 per cent, there are several decreases around 2.0 per cent this past month. And in some particularly notable cases the one-month decline is over 3.0 per cent. Take for example the one-month price decrease of 3.4 for condominiums in Burnaby East or the 2.6 per cent decrease for townhouse in Ladner. Of course, we have been tracking a trend of month-over-month decreases in all residential properties since the middle of last summer when several financial constraints for buyers came into effect, but I suspect the post-Christmas effect has also contributed to some of these exceptional price drops during January. I highly recommend that anyone eager to make a deal with a good purchase price at this time of year take a close look at the benchmarks across all property types listed below.
COMBINED BENCHMARKS
The combined benchmark for all property types in Metro Vancouver at the end of January 2019 was $1,019,600, a decrease of 4.5 per cent from one year earlier, and a 1.2 per cent decrease from the preceding month. In the Fraser Valley the combined benchmark for all property types at the end of January 2019 was $821,100, a decrease of 0.8 per cent from one year earlier and 1.6 per cent decrease from the previous month.
METRO VANCOUVER
Big increase in new property listings
In Metro Vancouver new property listings increased dramatically during January, another excellent reason to look consider a home purchase at this time. There were over 10,000 residential properties on the market at the end of last month. The new listings this past January were an extraordinary 244.6 per cent higher than listings in the preceding month.
Detached Homes
The benchmark price for a single-family detached home in Metro Vancouver at the end of January was $1,453,400, a decrease of 1.7 per cent from the preceding month. The extremities of this average were Vancouver West (not West Vancouver) at $3.049,700 and the Sunshine Coast at $600,000. (Note I include the Sunshine Coast region only as a factor in the average, but I do not report on housing prices in this area because it is to far away for my clients). The three municipalities closest to the benchmark on the higher side of the average were: Port Moody at $1,454,500, a decrease of 2.1 per cent from the previous month; North Vancouver at $1,512,200, a decrease of 1.9 per cent from the preceding month; and Burnaby South at $1,533,700, a decrease of 2.3 per cent from the preceding month. The three municipalities closest to the benchmark on the lower side of the average were: Vancouver East at $1,428,700, a decrease of 1.3 per cent from the preceding month; Burnaby North at $1,415,300, a decrease of 2.3 per cent from the previous month; and Coquitlam at $1,195,000, a decrease of 1.5 per cent from the preceding month.
Townhouses
The benchmark price for a townhouse in Metro Vancouver at the end of January was $800,600, a decrease of 1.1 per cent from the preceding month. The extremities of this average were Vancouver West (not West Vancouver) at $1,216,600 and Maple Ridge at $538,700. The three municipalities closest to the benchmark of the higher side of the average were: Richmond at $808,200, a decrease of 1.4 per cent from the preceding month; Vancouver East at $848,200, a decrease of 0.2 per cent from the preceding month; and North Vancouver at $979,900, a decrease of 1.4 per cent from the preceding month. The three municipalities closest to the benchmark on the lower side of the average were: Burnaby South at $792,800, an increase of 0.3 per cent from the preceding month; Ladner at $740,500, a decrease of 2.6 per cent from the preceding month; and Tsawwassen $732,200, a decrease of 2.2 per cent from the preceding month. (Note: I have not included Whistler in this comparison as it is too far out for my clients)
Condominiums
The benchmark price for a condominium in Metro Vancouver at the end of January was $658,600, a decrease of 0.8 per cent from the preceding month. The extremities of this average were West Vancouver at $1,108,800 and Maple Ridge at $359,500. The three municipalities closest to the benchmark on the higher side of the average were: Burnaby South at $687,900, an increase of 0.3 per cent from the preceding month; Burnaby East at $743,900, a 3.4 per cent decrease from the preceding month; and Vancouver West (not West Vancouver) at $783,400, no change from the preceding month. The three municipalities closest to the benchmark on the lower side of the average were: Richmond at $657,500, a decrease of 1.6 per cent from the preceding month; Port Moody at $629,400, an increase of 0.3 per cent from the preceding month; and Burnaby North at $606,400, a decrease of 2.0 per cent from the preceding month.
FRASER VALLEY
Even bigger Increase in new listings
New listings in the Fraser Valley in January made an even bigger jump than in Metro Vancouver. Fraser Valley new listings hit a 266.7 per cent increase over new listings in the preceding month. This brought the total Fraser Valley residential listings to nearly 6,000, making it an ideal time for buyers to look at the market and take advantage of the current month-over-month price drops. Keep in mind that newly listed properties in the Fraser Valley typically do not stay on the market for a long time. During this past January, single family homes remained on the market for an average of 55 days. Townhouses averaged 44 days and condominiums 45 days. It’s also notable that last month, for the first time, condominiums outsold detached homes in the Valley. The Fraser Valley remains a highly desirable area for young families and singles making their first home purchase. I highly recommend taking a look for a good deal at this time.
Detached Homes
The benchmark price for a single-family detached home in the Fraser Valley at the end of January was $954,100, a decrease of 1.2 per cent from the preceding month. The extremities of this average were South Surrey/White Rock at $1,351,300 and Mission at $662,700. The three municipalities closest to the benchmark on the higher side of the average were: North Surrey at $956,400 a decrease of 1.8 per cent from the preceding month; Cloverdale at $978,700, a decrease of 0.4 per cent from the preceding month; and Langley at $980,300, a decrease of 2.3 per cent from the preceding month. The three municipalities closest to the benchmark on the lower side of the average were: North Delta at $879,600, a decrease of 0.9 per cent from the preceding month; Abbotsford at $777,900, a decrease of 1.9 per cent from the preceding month; and Mission at $662,700, an increase of 1.7 per cent from the preceding month.
Townhouses
The benchmark price for a townhouse in the Fraser Valley at the end of January was $522,100, a decrease of 1.9 per cent from the preceding month. The extremities of this average were South Surrey/White Rock at $669,000 and Abbotsford at $377,100. The three municipalities closest to the benchmark on the higher side of the average were: Cloverdale at $532,400, a decrease of 3.3 per cent from the preceding month; North Surrey at $569,200, a decrease of 1.5 per cent from the preceding month; and Surrey at $569,900, a decrease of 1.9 per cent from the preceding month. The three municipalities closest to the benchmark on the lower side of the average were: Langley at $485,000, a decrease of 2.0 per cent from the preceding month; Mission at $451,500, a decrease of 1.0 per cent; and Abbotsford at $377,100, a decrease of 1.6 per cent from the preceding month.
Condominiums
The benchmark price for a condominium in the Fraser Valley at the end of January was $409,000, a decrease of 2.2 per cent from the preceding month. The extremities of this average were South Surrey/White Rock at $481,000 and Abbotsford at $307,000. The three municipalities closest to the benchmark on the higher side of the average were: Surrey at $417,900, a decrease of 2.4 per cent from the preceding month; Cloverdale at $454,400, a decrease of 2.9 per cent from the preceding month; and South Surrey/White Rock at $481,000, a decrease of 3.8 per cent from the preceding month. The three municipalities closest to the benchmark on the lower side of the average were: Langley at $408,800, a decrease of 1.0 per cent from the preceding month; North Surry at $400,800, a decrease of 2.1 per cent from the preceding month; and North Delta at $391,000, a decrease of 2.2 per cent from the preceding month.
I can help
Please feel free to call me if you need help with any decision making, or if you just want to chat about market conditions in general. If you need specific information on a particular property or neighbourhood, I am more than happy to do an analysis of the area of you. I also have professional experience in banking and finance and will gladly guide you through your mortgage requirements.
Thanks for reading!
Sibo Zhang, REALTOR®

Declining Prices Continue Into the New Year
A new year is upon us, and I welcome you back from the holiday season just past.
Everyone is wondering of course, what the residential market will do in the year ahead of us. It’s natural to want to gaze into the proverbial crystal ball to predict the future. And while I’m afraid I don’t have such a fortune telling device, I can advise you on the trend that is continuing from the end of last year.
In general, average home prices (benchmarks) are showing slight declines each month, although there are still minor upticks here and there, which is normal in any active market. Looking back at 2018 we can see the skyrocketing prices that had been occurring since 2016 suddenly peaked at the end of June last year. They have been declining in small increments each month since. We can safely surmise that this dramatic reversal resulted from government measures to cool the market: provincial foreign ownership and speculation taxes combined with new federal rules for stricter mortgage qualification.
Add to all this, higher variable mortgage rates pushed up by Canada’s central bank’s rising interest rates and it’s easy to see why prices are dropping. In the last six months of 2018, the cumulative decline was 6.5 per cent.
Forecasts and current trends
The first thing I will say about this trend is that there is no reason to think it will not continue into the near future. But exactly how long is anybody’s guess. I want to be very upfront with you about this. I will not tell anyone to list or buy at a specific time based solely on market statistics for two reasons: First, even an educated guess is still a guess, and two (more importantly), there are many personal and individual factors that need to be taken into consideration in such an important transaction. What I am able to do for my clients during a period of indecision is to help them evaluate what their needs are, both financial and for living accommodations, and how to develop a sound strategic plan based on their individual circumstances. This may be something like setting a threshold or target price to wait for, or a preparing a comparative market analysis on a property you are considering at the present time. I have also been able to assist clients in deciding on renovations that will help to maximize their value when they decide to sell; or to help prospective buyers with the features they want for their individual tastes.
Newsletter in 2019
I will continue to provide a monthly snapshot of benchmark prices for all property types across the Lower Mainland based on the latest statistics. I know readers like to watch these monthly changes in average prices. The cooling market has shifted from a sellers’ market to a buyers’ market since July last year, meaning that buyers don’t have to make offers frantically, as they did when the prices were soaring. A couple of statistics that I will include in this new environment are one-year and ten-year comparisons so you can get some idea of what the current benchmarks mean during this current period.
Combined Benchmark
The combined benchmark for all property types in Metro Vancouver at the end of December 2018 was $1.032,400, a decrease 2.7 per cent decrease from one year earlier, and a 0.9 decrease from the preceding month. This benchmark price is 102.5 per cent higher than 10 years ago. In the Fraser Valley the combined benchmark for all property types at the end of 2018 was $834,700, an increase of 2.5 per cent from one year earlier and a 0.8 per cent decline from the previous month. This benchmark price is 97.0 per cent higher than 10 years ago.
METRO VANCOUVER BENCHMARKS
Detached Homes
The benchmark price for a single family detached home in Metro Vancouver at end of December 2018 was $1,479,7000, a decrease of 1.4 per cent from the preceding month. The extremities of this average were Vancouver West (not West Vancouver) at $3,138,400 and the Sunshine Coast at $613,700. (Note I include the region only as a factor in the average, but I do not report on housing prices in this area because it is to far away for my clients). The three municipalities with benchmarks closest on the higher side of the average were: Port Moody at $1,485,300, a decrease of 0.9 per cent from the preceding month; North Vancouver at $1,569,800, a decrease of 2.6 per cent from the preceding month; and Burnaby South at $1,569,800, a decline of 2.6 per cent from the preceding month. The three municipalities closest to the benchmark on the lower side of the average were: Burnaby North at $1,448,900, a decrease of 1.4 per cent from the preceding month; Vancouver East at $1,447,300, a decrease of 1.6 per cent from the preceding month; and Coquitlam at $1,214,300, a decrease of 1.3 per cent from the preceding month.
Townhouses
The benchmark price for a townhouse in Metro Vancouver at the end of December 2018 was $809,700, a decrease of 1.1 per cent from the preceding month. The extremities of the average were Vancouver West (not West Vancouver) at $1,140,900 and Maple Ridge at $360,800. The three municipalities closest on the higher side of this average were: Richmond at $819,800, a decrease of 2.4 per cent from the preceding month; Vancouver East $850,000, an increase of 2.3 per cent from the preceding month; and North Vancouver at $994,300, a decrease of 2.0 per cent from the preceding month. The three municipalities closest on the lower side of this average were: Burnaby South at $790,800, a decrease of 0.9 per cent from the preceding month; Ladner at $760,500, a decrease of 1.2 per cent from the preceding month; and Tsawwassen at $748,800, an increase of 1.3 per cent from the preceding month.
Condominiums
The benchmark price for condominium in Metro Vancouver at the end of December 2018 was $664,100, a decrease of 0.6 per cent from the previous month. The extremities of the average were West Vancouver at $1,140,900 and Maple Ridge at $360,800. The three municipalities closest on the higher side of this average were: Richmond at $668,500, an increase of 1.5 per cent from the preceding month; Burnaby South at $685,700, a decrease of 0.6 per cent from the preceding month; and Burnaby East at $770,300, an increase of 1.0 per cent from the preceding month. The three municipalities closest on the lower side of this average were: Port Moody at $627,300, a decrease of 2.9 per cent from the preceding month; Burnaby North at $619,100, a decrease of 2.1 per cent from the preceding month; and North Vancouver at $567,300, a decrease of 1.2 per cent from the preceding month.
FRASER VALLEY BENCHMARKS
Detached Homes
The benchmark price for a detached home in the Fraser Valley at the end of December was $965,300, a decrease of 1.1 per cent from the previous month. The extremities of this average were South Surrey/White Rock at $674,100 and Mission at $651,900. The three municipalities closest on the higher side of this average were North Surrey at $973,500, a decrease of 0.6 per cent from the preceding month; Cloverdale at $982,200, an increase of 0.1 per cent from the preceding month; and Langley at $1,003,000, a decrease of 0.6 per cent from the preceding month. The three municipalities closest on the lower side of this average were: North Delta at $887,800, a decrease of 2.8 per cent from the preceding month; Abbotsford at $792,600, a decrease of 1.3 per cent from the preceding month; and Mission at $651,900, a decrease of 0.4 per cent from the preceding month.
Townhouses
The benchmark price for a townhouse in the Fraser Valley at the end of December was $531,900, a decrease of 0.2 per cent from the preceding month. The extremities of this average were South Surrey/White Rock at $572,100 and Abbotsford at $314,000. The three municipalities closest on the higher side of this average were: Cloverdale at $550,400, a decrease of 0.9 per cent from the preceding month; North Surrey at $577,600, a decrease of 1.9 per cent from the preceding month; and Surrey at $581,000, an increase of 0.5 per cent from the preceding month. The three municipalities closest on the lower side of this average were: Langley at $494,700, a decrease of 0.4 per cent from the preceding month; Mission at $455,900, an increase of 2.7 per cent from the preceding month; and Abbotsford at $383,400, a decrease of 2.1 per cent from the preceding month.
Condominiums
The benchmark price for a condominium in the Fraser Valley at the end of December was $418,300, a decrease of 1.0 per cent from the preceding month. The extremities of this average were South Surrey/White Rock at $500,100 and Abbotsford at $314,000. The three municipalities closest on the higher side of this average were: Surrey at $428,200, a decrease of 0.9 per cent from the preceding month; Cloverdale at $468,100, a decrease of 0.7 per cent from the preceding month; and South Surrey/ White Rock at $500,100, a decrease of 1.2 per cent from the preceding month. The three municipalities closest on the lower side of this average were: Langley at $413,100, a decrease of 0.9 per cent from the preceding month; North Surrey at $409,600, a decrease of 1.0 per cent from the preceding month; and North Delta at $400,000, a decrease of 0.8 per cent from the preceding month.
QUESTIONS? PLEASE LET ME KNOW
Please remember, I make my family home in Surrey and we are proud to see our city grow with the neighbourhood amenities that make for a wonderful life here. I am here to help with whatever your real estate needs may be. As a consistently recognized top-tier realtor, and with experience in finance, banking and real estate sales, I am happy to advise you, without pressure, so you can make a choice that will lead to your long-term happiness. Please let me know if I can help.
With my wife and two children, we wish you the very best for 2019.

November Market Update for Metro Vancouver and the Fraser Valley
Slight monthly price declines continue, but some prices are levelling.
Continue reading →
Prices continue down, inventory up
The trend I have been reporting for several months is continuing. Residential prices are continuing their overall decline across the lower mainland. With the astronomical price increases prior to this current period, even a relatively small price drop of 1.0 per cent can be attractive to a buyer who would surely enjoy a $10,000 savings on a $1-million property with just one month’s change. Nonetheless, many prospective buyers are holding off as they hope to see the downward trend continue. This may prove beneficial or not; it’s still a guessing game how long the trend will continue. There could be quick change in buyer psychology that creates a spurt in demand any time, which would send prices upward again. From the seller’s point of view, it is important to note that new listings are actually increasing at this time. While this might be seen as seller concern that prices will continue to drop, it is also providing a high supply of available properties on the market, which has a further dampening effect on prices. In short, it’s a buyer’s market right now so if you are seriously wanting to get into a home this is a good time to make an offer. The combined benchmark price for all property types in the Lower Mainland at the end of September was $1,003,500, a decrease of 1.2 per cent from the preceding month. Below is my monthly review of benchmark prices for each property type.
METRO VANCOUVER
Detached homes
The benchmark price for a single family detached home in Metro Vancouver at the end of September was $1,540,900, a decrease of 1.3 per cent from the preceding month. This average had the extremities of Vancouver West (not West Vancouver) at $3,254,200 and Maple Ridge at $864,500. The three municipalities with benchmark prices closest on the higher side of the Metro average were: South Burnaby at $1,589,600, a decline of 1.9 per cent from the preceding month; North Vancouver at $1,620,300, a decline of 1.8 per cent from the preceding month; and Richmond at $1,662,600, a decline of 0.4 per cent from the preceding month. Closest to the Metro Benchmark on the lower side of the average were: Port Moody at $1,504,300, a decline of 1.9 per cent from the preceding month; Vancouver East at $1,502,900, a decline of 1.7 per cent from the preceding month; and North Burnaby at $1,498,100, a decline of 0.2 per cent from the preceding month.
Townhouses
The benchmark price for a townhouse in Metro Vancouver at the end of September was $837,600, a decrease of 1.0 per cent from the preceding month. This average had the extremities of Vancouver West (not West Vancouver) at $1,229,300 and Maple Ridge at $558,800. The three municipalities with benchmark prices closest to the higher side of the Metro average were: Richmond at $862,400, a decrease of 0.4 per cent from the preceding month; Vancouver East at $873,400, a decrease of 2.3 per cent from the preceding month; and North Vancouver at $1,021,900, a decrease of 0.8 per cent from the preceding month. Closest to the Metro benchmark on the lower side of the average were: South Burnaby at $822,700, a decrease of 2.2 per cent from the preceding month; Ladner at $786,300, a decrease of 3.9 per cent from the preceding month; and Tsawwassen at $770,500, a decrease of 2.9 per cent from the preceding month.
Condominiums
The benchmark price for a condominium in Metro Vancouver at the end of September was $687,300, a decrease of 1.2 per cent from the preceding month. This average had the extremities of West Vancouver at $1,213,900 and Maple Ridge at $364,100. The three municipalities with benchmark prices closest to the higher side of the Metro average were: Richmond at $690,600, a decrease of 0.7 per cent from the preceding month; South Burnaby at $709,800, a decrease of 1.1 per cent from the preceding month; and Vancouver West (not West Vancouver) at $804,800, a decrease of 2.5 per cent from the preceding month. Closest to the Metro benchmark on the lower side of the average were: Port Moody at $666,400, a decrease of 0.4 per cent from the preceding month; North Burnaby at $644,600, a decrease of 1.0 per cent from the preceding month; and North Vancouver at $595,700, a decrease of 0.1 per cent from the preceding month.
FRASER VALLEY
The trend in declining prices across the lower mainland is in all respects very much the same in the Fraser Valley. As in Metro Vancouver buyers are exercising the same hesitation as they watch monthly price declines, unsure when demand may suddenly surge again. My sense is that there is considerable pent-up demand by prospective buyers, so it’s likely going to be some price point in each property type that triggers a resurgent buying spree. In the mean time, as in Metro Vancouver, the inventory of Fraser Valley properties continues to grow, a sign that more sellers are wanting to get the best price possible in the current downward price trend. In fact, the overall supply at present is at its highest point for the year, so there’s a good choice for buyers right now. New Fraser Valley listings during the month of September reached nearly 3,000, which was more than a 14 per cent increase from the number of listings made in August. This brings the end of September inventory of properties on the market in the Fraser Valley to a total of 7,647. The combined benchmark price for all Valley-listed properties at the end of September was $860,300, a decrease of 1.3 per cent from the preceding month. Below is my monthly review of Fraser Valley benchmark prices in each property type at the end of September.
Detached homes
The benchmark price for a single family detached home in the Fraser Valley at the end of September was 988,900, a decrease of 2.0 per cent from the preceding month. This average had the extremities of South Surrey/White Rock at $1,397,400 and Mission at $668,300. The three municipalities with benchmark prices closest to the higher side of the Valley benchmark were: Cloverdale at $1,004,500, a decrease of 0.6 per cent from the preceding month; Langley at $1,027,000, a decrease of 2.2 per cent from the preceding month; and Surrey at $1,035,600, a decrease of 0.9 per cent from the preceding month. Closest to the Valley benchmark on the lower side of the average were: North Surrey at $969,300, a decrease of 2.7 per cent from the preceding month; North Delta at $931,000, a decrease of 2.0 per cent from the preceding month; and Abbotsford at $810,800, a decrease of 2.2 per cent from the preceding month.
Townhouses
The benchmark price for a townhouse in the Fraser Valley at the end of September was $546,100, decrease of 0.1 per cent from the preceding month. This average had the extremities of South Surrey/White Rock at $679,900 and Abbotsford at $407,300. The three municipalities with benchmark prices closest to the higher side of the Valley benchmark were: North Delta at $571,900, a decrease of 4.5 per cent from the preceding month; Surrey at $583,500, a decrease of $583,500, a decrease of 0.9 per cent; and Cloverdale at $593,000, a decrease of 0.5 per cent from the preceding month. Closest to the Valley benchmark on the lower side of the average were: Langley at $509,100, a decrease of 1.7 per cent from the preceding month; Mission at $444,100, a decrease of 0.4 per cent from the preceding month; and Abbotsford at $407,300, a decrease of 1.0 per cent from the preceding month.
Condominiums
The benchmark price for a condominium in the Fraser Valley at the end of September was $438,700, a decrease of 1.0 per cent from the preceding month. This average had the extremities South Surrey/White Rock at $502,700 and Abbotsford at $333,200. The three municipalities with benchmark prices closest to the higher side of the Valley benchmark were: Surrey at $456,100, a decrease of 2.0 per cent from the preceding month; Cloverdale at $494,900, a decrease of 2.4 per cent from the preceding month; and South Surrey/White Rock at $502,700, a decrease of 0.7 per cent from the preceding month. Closest to the Valley benchmark of the lower side of the average were: Langley at $431,900, a decrease of 1.6 per cent from the preceding month; North Surrey also at $431,900, a decrease of 0.3 per cent from the preceding month; and North Delta at $429,700, a decrease of 0.6 per cent from the preceding month.
I am here to help
I hope my review of residential prices this month is helpful to both buyers and sellers across the lower mainland. As I mentioned above, the trending decline in prices across all property types is being accompanied by a trend in the opposite direction, namely an increasing number of new listings each month. This current market is therefore a buyers’ market. With the high number of listed properties at this time, making an offer is much less likely to create a bidding war driving up the price. This makes your financial planning more predictable and less stressful, particularly when you have negotiated a mortgage ahead of time and know what monthly payments can be managed within your budget. I highly recommend for these reasons that if you really want to get into a home, this is an excellent time to make the move. Please feel free to give me call to ask for any further information for any area you are thinking about. I am happy to help in any way I can.
Thanks for reading!
Sibo Zhang, REALTOR®
Surrey Election
Surrey’s election day is coming later this month and I encourage everyone to familiarize themselves with the important issues being championed by the various slates as well as independent candidates. If you can’t make it to the poll on October 20, you can find six advance polling stations on October 6, 10, 11 and 13 by clicking here on the voting location map.
All voting locations are open from 8:00 am to 8:00 pm on Saturday, October 20th. Surrey voters will be electing a mayor and eight city councillors as well as six school trustees for School District No. 36.
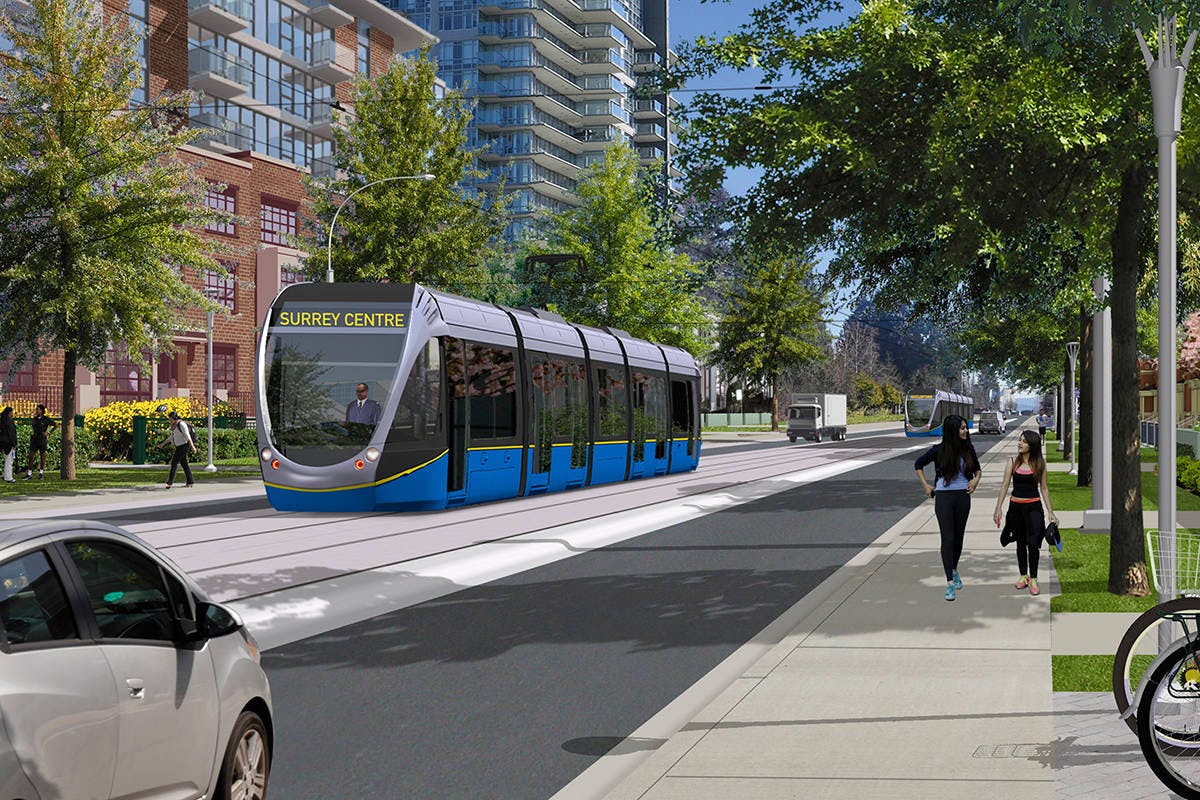
Surrey’s LRT Debated – Again!
I normally wouldn’t provide my own opinion on how to vote, but in the forthcoming election there is one issue that has been raised recently by a couple of mayoral candidates, and I feel compelled comment to on it. It is the re-opening of a debate that has not only been completed, decided, and finalized, but for which funding from the federal and provincial governments as well as Translink has been secured, allocated and announced, namely plans for the city’s Light Rail Transit (LRT) system. In fact, preliminary construction along some corridors has already begun, and finally after years of consultations and planning, we are poised to get going with a much-needed transportation system for our region. To me it nothing short of irresponsible for politician to sow seeds of dissent at this time for their own political agenda, particularly politicians who previously supported the LRT. The two mayoral candidates who are trying to turn the clock back on this issue should be ashamed of themselves. Both Bruce Hayne, leader of the Integrity Now slate and Doug McCallum leader of the Safe Surrey Coalition, have made a 180-degree turnaround from their former positions supporting the LRT when they were previously in political office in Surrey. What kind of integrity does this show? There has been so much consultation and planning on this issue, years being examined by Translink’s Mayor’s Council and in Surrey City Hall, it is truly amazing that any politician should have the audacity to try to stir it all up again. Now they are prepared to reverse their positions just to satisfy their political ambitions, to create publicity through controversy, even it causes a setback to Surrey’s critical transportation for many more years.
Last May I wrote in my blog about the benefits of the LRT system for Surrey, including reduced congestion, increased traffic capacity, time savings and as a catalyst to local development including attracting and creating more jobs. In cities all over the world, LRT is generally considered more aesthetically pleasing to trains elevated by massive concrete pylons. An LRT creates more a sense of community as it can be boarded easily at street level and encourages people to leave their cars at home for many short trips, reducing GHG emissions as well. Surrey is the fastest growing urban municipality in Canada and is earning a great reputation as a culturally diverse and sophisticated centre recognized for its international character. An LRT transportation system can only enhance our civic environment as it has in beautiful cities around the world like Adelaide, Dublin, Rio de Janeiro and Edinburgh.
One of the problems with planning public transportation systems is that big budget projects are often poorly executed because the political bodies that make the decisions have much shorter in their terms in office than the length of the completed project. Financial decisions are too often forced into the short-term expediency or a political agenda or budget. While I fully support an open and democratically governed society, there are sometimes when I see the advantages of a centrally planned economy like China. The tremendous transportation systems that work for very heavily populated cities there could only be achieved with the kind of long-term projects that keep to a plan once it is settled. We almost need a transportation Czar here to get things done.
Let’s keep moving forward, not backwards.
Thanks for reading!
Sibo Zhang, REALTOR®
Image via Surrey Now-Leader

Your Market Update for July 2018
With the Bank of Canada’s recent announcement of an interest rate rise of 0.25 per cent, we are already seeing some commercial banks raise their prime mortgage rates. This is not a surprise and is in fact the fourth such interest rate increase by the Bank of Canada in the last 12 months. For anyone with a variable rate mortgage, their monthly payments will increase accordingly. For those who have not yet negotiated a mortgage and were hoping to do so soon, the rate will be slightly higher. But the effect of these rate increases is not all negative.
METRO VANCOUVER
I reported last month, various factors including higher interest rates and stricter mortgage requirements appear to be dampening demand for home sales in Metro Vancouver, and the latest figures show a decline in sales activities is continuing. The upside is that for prospective home buyers, the inventory of available homes at the end of June was at a three-year high. At the end of June, the total number of homes listed for sale in Metro Vancouver was 11,947, of which over 5,000 were listed in June alone. Yet, sales at the end of last month were close to 30 per cent below the ten-year average. So, I am encouraging anyone who is seriously looking for a home to take advantage of the big selection on the market now. With the reduced demand, you are less likely to get into a bidding war for a property you want. In fact, the overall Benchmark price of $1.093,600 for a residential property in Metro Vancouver at the end of June remained unchanged from the previous month. Anyone who has been watching prices escalate for several years will recognize the significance of the current price stability. It is a buyer’s market currently. Below I have selected areas for each of property type which are closest to the Metro benchmark on both the higher and lower sides of this average.
Detached Properties
The benchmark price for a detached home in Metro Vancouver at the end of June was $1,598,200, a decrease of 0.6 per cent from the preceding May. This benchmark average was made of benchmark prices between the extremities of the Sunshine Coast at $628,000 and Vancouver West at $3,392,500. (Note this is not West Vancouver which was at $2,944,900.) I have selected three areas which are closest on both sides for the Metro benchmark. On the higher side of the benchmark were: Richmond at $1,648,600, a decrease of 1.0 per cent from the preceding month; North Vancouver at $1,683,680, a decrease of 1.5 per cent from the preceding month; and Burnaby South at $1,712,400, an increase of 2.5 per cent from the preceding month. Closest to the Metro Benchmark on the lower side of the average were: Port Moody at $1,551,900, an increase of 1.5 per cent from the preceding May; Vancouver East at $1,541,400, a decrease of 0.1 per cent from the preceding May; and Burnaby North at $1,538,900, a decrease of 2.3 per cent from the preceding month.
Townhouses
The benchmark price for a townhouse in Metro Vancouver at the end of June was $859,800, which was unchanged from the preceding month. This benchmark average was made of benchmark prices between the extremities of Maple Ridge at $574,300 and West Vancouver at $1,303,600. I have selected three areas which are closest on both sides for the Metro benchmark. (I have excluded from this selection the areas of Squamish and Whistler which are too far out for most of my clients.) On the higher side of the benchmark were: Vancouver East at $923,400, a decrease of 0.3 per cent from the preceding May; North Vancouver at $1,049,900, an increase of 1.4 per cent from the preceding May; and Vancouver West at $1,303,600, a decrease of 0.1 per cent from the preceding May. Closest to the Metro benchmark on the lower side of the average were: Burnaby South at $856,400, an increase of 1.8 per cent from the preceding May; Richmond at $854,800, an increase of 1.0 per cent from the preceding May; and Ladner at $778,000, a decrease of 1.2 per cent from the preceding May.
Condominiums
The benchmark price for a condominium in Metro Vancouver at the end of June was $704,200, an increase of 0.4 per cent from the preceding May. This benchmark average was made of benchmark prices between the extremities of Pitt Meadows at $480,300 and West Vancouver at $1,286,500. I have selected three areas which are closest on both sides for the Metro benchmark. On the higher side of the average were: Burnaby South at $737,000 and increase of 1.1 per cent from the preceding May; Vancouver West at $842,600, a decrease of 0.3 per cent from the preceding May; and West Vancouver at $1,286,500, an increase of 0.5 per cent from the preceding May. Closest to the Metro benchmark on the lower side of the average were: Burnaby East at $701,400, a decrease of 2.0 per cent from the preceding May; Port Moody at $699,200, an increase of 0.9 per cent from the preceding May; and Richmond at $683,800, an increase of 2.0 per cent from the preceding May.
FRASER VALLEY
As it the case in Metro Vancouver, the inventory of residential properties in the Fraser Valley continued to increase. The total number of listings across all property types rose to 7,141 at the end of June, an increase of 6 per cent from the preceding May, providing an excellent selection for prospective home buyers this summer. If you haven’t yet found the residence you’ve been looking for in the Valley, then I strongly recommend you look at some newly listed properties this month. There were over 3,100 new listings in June alone. Prices are holding steady at present with a slight decrease in some cases – the average across all property types at the end of June decreased 4.9 per cent from the preceding May — so if you eager to buy this appears to be one a favourable time for buyers. Sales activity is still brisk, however, and properties can sell quite soon after they are listed. Last month the average time for a single family detached home was on the market in the Fraser Valley was 26 days; townhouses sold on average after 19 days, and condominiums after 21 days. As has been the case for some time, townhouses and condominiums make up just over 50 per cent of all sales, but detached properties are still a favourite for many families who want to enjoy Valley life with their children. Below is my selection this month for the three property types with benchmark prices at then end June in areas where I think you will find some excellent value.
Detached Homes
The benchmark price for a detached property in the Fraser Valley at the end June was $1, 018,900, a 0.2 per cent decrease from the preceding May. The extremities of this average were $1,073,700 in Langley and $692,300 in Mission. Here is my selection for the three closest benchmark prices on both the higher and lower sides of this Valley benchmark. On the higher side of the average were: Cloverdale at $1,036,600, a 1.1 per cent decrease from the preceding May; Surrey at $1,53,600, a 0.3 per cent increase from the preceding May; and Langley at $1,73,700, a 0.4 per cent increase from the preceding May. Closest to Fraser Valley benchmark on the lower side of the average were: North Surrey at $998,900, a 0.5 per cent decrease from the preceding May; North Delta at $957,800, a 0.1 per cent decrease from the preceding May; and $840,700, a 0.5 per cent increase from the preceding May.
Townhouses
The benchmark price for a townhouse in the Fraser Valley at the end of June was $558,000, an increase of 0.4 per cent from the preceding May. The extremities of this average were $680,800 in South Surrey/White Rock and $409,400 in Abbotsford. Here is my selection of the three closest benchmark prices on both the higher and lower sides of this Valley benchmark. On the higher side of the average were: North Surrey at $589,400, a decrease of 0.7 per cent from the preceding May; Surrey at $598,000, an increase of 0.9 per cent from the preceding May; and Cloverdale at $618,300, an increase of 0.2 per cent from the preceding May. Closest to the Valley benchmark on the lower side of the average were: Langley at $527,900, a decrease of 0.2 per cent from the preceding May; Mission at $441,800, a decrease of 1.8 per cent from the preceding May; and Abbotsford at $409,400, an increase of 3.5 per cent from the preceding May.
Condominiums
The benchmark price for condominium in the Fraser Valley at the end of June was $453,500, an increase of 0.1 per cent from the preceding May. The extremities of this average were $516,000 in South Surrey/White Rock and $356,800 in Abbotsford. Here is my selection of the three closest benchmark prices on both the higher and lower sides of this Valley benchmark. On the higher side of the average were: Surrey at $464,300, a decrease of 0.5 per cent from the preceding May; Cloverdale at $513,000, an increase of 0.6 per cent from the preceding May; and South Surrey/White Rock at $516,000, a decrease of 1.4 per cent from the preceding May. Closest to the Valley benchmark on the lower side of the average were: Langley at $448,500, a decrease of 1.2 per cent from the preceding May; North Surrey at $443,800, an increase of 1.0 per cent from the preceding May; and North Delta at $433,200, a decrease of 0.1 per cent.
The summer weather is now making it enjoyable to take a drive around the community where you would like to locate your new residence. I encourage you to view some of the open houses that you see and compare their features to what find properties priced close to the benchmark prices I have mentioned above. Remember that a benchmark price is an average based on home with similar characteristics, so be sure to note any features that you really want in your new home. I am always happy to provide you with more information in any property type in whatever area you are interested in, so please feel free to give me a call, whether you are just curious about the market or are at the stage of planning on buying or listing.
fr

How to Spend July in Surrey, BC
Now that July is here and kids are out of school for the summer, it’s time again to post some of the great activities happening this month in Surrey. Our Canada Day celebration on July 1 was a super way to kick of this month and was a great success with entertainment and activities for the whole family at the Bill Reid Millennium Amphitheatre. Here are some other activities for the rest of July.
A fun way to stay cool: swimming
If you are looking for somewhere to stay cool when the July weather gets hot in Surrey there are public swimming pools which are now open until September, and they’re free! Try a pool in your area. There are great outdoor pools in all around Surrey so you won’t have to drive a long way to find one. Here’s a list of neighbourhood outdoor pools:
- Sunnyside Outdoor Pool at 15433 – 26 Avenue in South Surrey
- Bear Creek Outdoor Pool at 13820 – 88 Avenue in North Surrey
- Kwantlen Outdoor Pool at 13035 – 104 Avenue in North Surrey
- Unwin Outdoor Pool at 6845 – 133 Street in Newton
- Greenaway Outdoor Pool at 17901 – 60 Avenue in Cloversdale
- Hjorth Road Outdoor Pool at 10277 – 148 Street in Guildford
- Holly Outdoor Pool at 10662 – 148 Street in Guilford
- Port Kells Outdoor Pool at 19340 – 88 Avenue in Guildford
There are also excellent indoor pools throughout Surrey but you will need to get a recreation pass for these: Grandview Heights Aquatic Centre; North Surrey Recreation Centre; South Surrey Indoor Pool; and the Surrey Sport and Leisure Complex.
There is also a great indoor wave pool at the Newton Recreation Centre at 13730 – 72 Avenue, and thanks to sponsorship by Fortis BC sponsorship, this is a free activity for the whole family to enjoy.
Newton Days
Newton also has a special program of summer events on four Saturdays this month. July 7, 14, 21, and 28 mark the return of the second Newton Days this year. On each of these Saturdays from noon to 4:00 pm at the Newton Grove there will be a number of fun events for families to enjoy such as a farms’ market, food trucks, and a free BBQ along with lots of activities for kids like a fun zone, face painting, and a Science World demonstration. Be sure to pick up your free $5.00 Farm voucher beforehand (one customer per day) at the Newton Recreation Centre, Newton Senior Centre, Newton Library, or from the Newton BIA photo booth.
Surrey’s neighbourhood parks are also great places for families with kids to enjoy this summer. Starting July 2 and running though to August 23, each of the parks will have free sports, games, and other activities.
On July 21 at Cloverdale Youth Park and Chuck Bailey Park there will be the Surrey Rides Tournament. Whether it’s on a skateboard, scooter or bike, young riders are invited to show their skills, as well as practice, in a safe and competitive environment provided in Surrey’s various parks. The Surrey Rises event series takes place at all Surry youth parks listed here:
- Bear Creek Park, 84 Avenue and King George Blvd.
- Chuck Bailey Youth Park, Tom Binnie Park at 12458 197 A Avenue.
- Cloverdale Youth Park, 17800 64 Avenue
- Fleetwood Youth Park, 16555 Fraser Highway
- Fraser Heights Youth Park, 10588 – 160 Avenue
- Guildford Youth Park, 15105 – 105 Avfenue
- Kwantlen Youth Park, 13035 – 104 Avenue
- South Surrey Youth Park, 14601 – 20 Avenue
Nature hikes and sights
If you would prefer a connection to nature, I recommend exploring Blackie Spit Park in the Crescent Beach area of South Surrey. Here you can find birds of many kinds. As one of the best bird watching areas in Canada, there are some 200 different species throughout the year. And basking in the sun on the sandbars you will see harbour seals and their pups. You can get some great walking exercise too. The nature trail around the park is 5 kilometre long and seeing the sights in this urban forest is a great way to spend a couple of hours.
Summer Music Series
Summer is Surrey is also rich in cultural life as well. This July you can take in some excellent music at free live performances featuring music styles from Bluegrass to New Orleans Jazz. Bring a blanket with you for these evening concerts and enjoy the music in one of these lovely park settings:
- July 4 in Glades of Garden Park at 561 – 172 Street it’s Pop-eclectica with Caviar & Lace from 6:30 pm to 8:00 pm.
- July 11 in Fleetwood Park at 15802 – 80 Avenue it Celtic with Tiller’s Folloy from 6:30 pm to 8:00 pm.
- July 18 in Bear Creek Park Garden at 13750 – 88 Avenue it’s Folk Blues with Cannery Row from 6:30 t0 8:00 pm.
- July 25 in Darts Hill Garden Park at 1633 – 170 Street there’s a free concert from 6:30 to 8:00 pm. Gates open at 5 pm, but note the park does not allow pets.
- And if it’s an afternoon concert that appeals to you, then on July 13 Darts Hill Garden Park from 1:00 to 2:30 pm there’s the Razz Matazz Trio jazz concert.
Surrey Fusion Festival
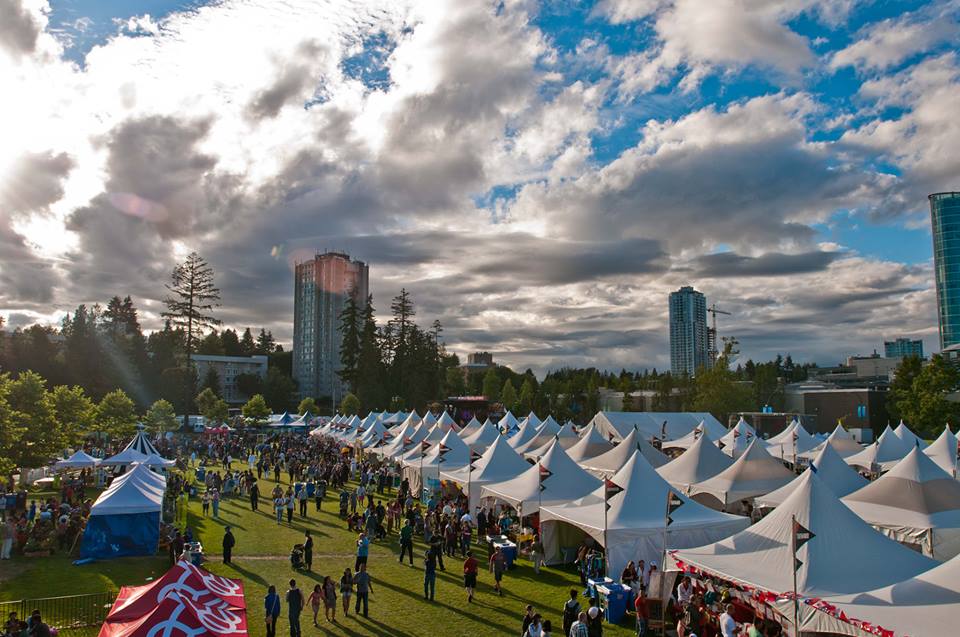
Photo via: https://www.facebook.com/pg/SurreyFusionFestival/
Of course, you don’t want to miss Surrey’s annual Fusion Festival which takes place this year July 21 and July 22. This is a must attend event in Holland Park just south of the Surrey Centre Mall. The festival is a fantastic multicultural celebration of Surrey’s incredibly diverse population and this year will host over 45 cultural and community groups from around the world including more than 150 artists and performers.
These are just some of the great summer activities happening in Surrey during July. I don’t have space to describe everything there is to do, but Surrey is never without fun activities. They show you why Surrey is such a great place to live and raise a family.
Thanks for reading!
Sibo Zhang, REALTOR®

Your Market Update for May 2018 – Greater Vancouver and the Fraser Valley
Home buyers in the Metro Vancouver area this month have more to be happy about than just the sunnier weather that is showing up more often!
There is also a brighter picture for home selection than has been the case for some time. Based on figures at the end of April, the number of new listings increased by nearly 31 per cent compared to the preceding month. That’s a big jump. In actual numbers it was 5,820 new listings across all property types, bringing the total inventory for detached homes, townhouses, and condominiums in Metro Vancouver to 9,822, so there is no doubt going to be considerable interest in open houses this month. If you are among those prospective buyers who have pre-qualified for a mortgage, then you have another advantage going for you. Your mortgage qualification would have made you aware of the more stringent requirements set by the federal government, which means that you will likely have fewer buyers competing for a property, and with the increased inventory this can help keep the price down. This was part of the government of the government strategy to slow the rate of price increases, and it appears to be working right now. However, there is still plenty of activity in the market to keep moving prices upward, although perhaps at a slower rate. Overall, Metro Vancouver prices across all property types inched up 0.7 per cent from the preceding month. Most of the sales that occurred in April were for condominiums which was close to 50 per cent of all sales activity. Townhouse sales took slightly over 36 per cent of the activity, and detached residences were just under 15 per cent. The Benchmark price for all property types at the end of April was $1,092,000
It is worth comparing the Benchmark price for detached properties in Metro Vancouver at $1,605,800 at the same time. With approximately $½-million difference from the overall benchmark, we can more clearly understand why many home buyers have opted for other types of residential properties. There’s actually been a slight decline of 0.2 per cent in detached properties from March to April this year. In fact, since April last year, there’s been a significant decrease of 33 per cent in detached property sales. Attached properties, on the other hand, showed a relatively larger month-over-month increase in the respective Benchmarks. Metro Vancouver condominiums had a Benchmark price of $701,000 at the end of April, which was a 1.1 per cent increase from March. Benchmark price of a townhouse was $854,200, a 2.3 per cent increase for the same period. Below is a survey of average prices for each property type in areas with the upper and lower sides are closest to the overall Benchmark. As usual, where the extremities include the Sunshine Coast, Squamish, or Whistler, I note the area for its high or low end of the average but do not survey the property types in these areas as they are too far from the Metro Vancouver area desired by my clients.
Single Detached Homes
The extremities of the Metro Vancouver average Benchmark for single detached homes were Vancouver West at $3,054,000 and the Sunshine Coast at $614,600. Municipalities with average prices closest to the Metro Benchmark on the higher side were South Burnaby at $1,675,800, a month’s increase of 0.1 per cent; North Vancouver at $1703,400, a month’s decrease of 1.2 per cent; and Richmond at $1,684,500, a month’s decrease of 1.4 per cent. Closest on the lower side of the Metro Benchmark were North Burnaby at $1,595,800, a month’s increase of 3.3 per cent; Vancouver East at $1,544,100, a month’s decrease of 1.3 per cent; and Port Moody at $1,510,200, a month’s increase of 1.7 per cent.
Townhouses
The Metro Vancouver Benchmark price for townhouses at the end of April 2018 was $854,200. The extremities of this average were West Vancouver at $1,302,200 and Maple Ridge at $585,200. Municipalities with average prices closest to the Metro Benchmark on the higher side were Vancouver East at $933,500, a month’s increase of 2,8 per cent; North Vancouver at $1,030,900, a month’s increase of 2.5 per cent; and Vancouver West at $1,302,200, a month’s increase of 2.5 per cent. Closest on the lower side of the Metro Benchmark were Richmond at $839,00, a month’s increase of 1.0 per cent; South Burnaby at $834,900, a month’s increase of 0.9 per cent; and Ladner at $786,100, a month’s increase of 0.8 per cent.
Condominiums
The Metro Vancouver Benchmark price for condominiums at the end of April 2018 was $701,000. The extremities of this average were West Vancouver at $1,295,900 and Maple Ridge at $329,000. Municipalities with average prices closest to the Metro Benchmark on the higher side were South Burnaby at $715,800, a month’s decrease of 1.5 per cent; East Burnaby at $731,500, a month’s increase of 0.5 per cent; and Vancouver West at $841,700, a month’s decrease of 0.4 per cent. Closest on the lower side of the Metro Benchmark were Port Moody at $692,300, a month’s increase of 2.5 per cent; Richmond at $684,100, a month’s increase of 3.7 per cent; and North Vancouver at $611,900, a month’s increase of 1.8 per cent.
Of general interest this month I want to draw you attention to those average prices that have declined over one month. You will note that most of the decreases are for the property type of Single Family Detached. While it is only a snapshot in time, it appears to confirm the overall picture for the Metro Vancouver Market sales activity, which is a move away from Single Family Detached to the other two property types. In condominium and townhouse categories, you see several month-over-month price increases that stand out as significantly higher than others. You may find these monthly changes a helpful key to watching the market both for purposes of obtaining a good current price, and for what could be a good investment property as well. Please call me if you would like any further information on any property type in a specific area. I am always happy to help you your individual needs.
FRASER VALLEY
The Fraser Valley, like the Greater Vancouver region, also saw an increase in housing inventory at the end of April. New property listings across all types increased by 3,429, nearly 20 pre cent more than new listings in March, bringing the total Valley inventory to 5,667. making for a great selection this Spring. However, even with a substantial increase in available residential properties, prices are continuing to rise each month. The combined Benchmark price for all residential property types across the lower mainland at the end of April was $1000,900, an increase of 0.9 per cent from the preceding month. But it’s important to note that this Spring the actual number of sales for the month of April was down close to 25 per cent compared to one year ago. This does not mean that demand is not still high for a Valley property, but it appears that there is some current hesitancy in the market which might be attributable to uncertainty about prices under new mortgage qualifying requirements. Nonetheless, there is still strong demand generally, and sales of townhouses and condominiums continues to dominate the market activity. One again, over 50 per cent of April’s total of 1,708 sales were for townhouses and condos. These two property types sell very quickly, with the average time after listing being 14 days for condominiums and 16 days for townhouses, compared to 26 days for a single detached home. The price point between single detached homes and the other types appears to be the basis for this difference in Fraser Valley sales activity. The Benchmark price for a single detached property at the end of April was $1,009,200. With the Benchmarks for townhouses and condos still below the $1-million mark, the Valley continues to be a favorite location for first time buyers, whether singles or young families. Below is a breakdown for this market segment with properties close to both sides of the average Benchmark in Fraser Valley areas.
Townhouses
The Benchmark price for a Fraser Valley townhouse at the end of April was $691,700. The high and low extremities for the average were in South Surrey/White Rock at $525,100 and Abbotsford at $346,600. Closest to the Benchmark on the higher side were North Surrey at $577,000, a month’s increase of 0.6 per cent; Surrey at $584,900, a month’s increase of 1.2 per cent; and North Delta at $604,800, a month’s increase of 2.3 per cent. On the lower side of the Benchmark were Langley at $524,400, a month’s increase of 1.8 per cent; Mission at $449,300, a month’s increase of 0.6 per cent; and Abbotsford at $390,200, a month’s increase of 1.9 per cent.
Condominiums
The Benchmark price for a Fraser Valley condominium at the end of April was $447,500. The high and low extremities of this average were South Surrey/White Rock at $525,100 and Mission at $346,300. Closest to the Benchmark on the higher side were Langley at $453,000, a month’s increase of 1.9 per cent; Surrey at $456,200, a month’s increase of 0.9 per cent; and Cloverdale at $509,000, a month’s increase of 0.4 per cent. On the lower side of the Benchmark were North Surrey at $432,600, a month’s increase of 1.8 per cent; North Delta at $424,500, a month’s decrease of 0.4 per cent; and Abbotsford at $346,600, a month’s increase of 3.0 per cent.
Thanks for reading!
Sibo Zhang, REALTOR®