surrey

Despite Covid-19, housing prices and new listings move upwards

What a difference a month can make! As every sector of our economy is trying to cope with COVID-19 disruptions, there are many sources of pressure on the housing market. At the beginning of March, we were beginning to see a resurgence in demand for residential properties in Greater Vancouver. A stifled market after a lengthy period of onerous mortgage rules that had reduced demand had come to end. Buyers who had been waiting to see how low prices would go were now rapidly making offers in an optimal period of low interest and eased mortgage lending requirements. In the first two weeks of March, before the full COVID-19 effect was felt, residential sales across Metro Vancouver jumped over 17 per cent from the preceding month, reaching over 46 per cent higher than one year earlier. Then, just as quickly, a decline set in for the last half of the month – undoubtedly attributable to the precautions necessitated by the epidemic. At present, this unprecedented situation can only be monitored for its impact on the real estate market in the short term. While sophisticated statistical models can provide us with best- and worst-case scenarios, the spread of the virus is ultimately dependent on the behavior of people. However, there is optimism across our region that we are making progress in slowing the rate of infections through social distancing and other safety measures. Of course, this has impacted the ability of home seekers to attend open houses but there is still much you can do online and by phone. For this reason, I want to provide you with information that is useful during this challenging time.

If we are to consider the effect of the coronavirus on our housing market, we must focus on the timing of events. With the surge in demand in early March, we can see some larger than usual price increases beginning to take place. There was also a close to an 11 per cent increase in new listings in Metro Vancouver in March compared with February. This may be interpreted as a shift from a lengthy period of being a “buyers’ market” now transitioning to a “sellers’ market.” What this means is that the underlying demand of housing is pushing upwards and encouraging more people to put their property up for sale as prices rise. I have been advising home buyers to move quickly for the past couple of months, and I still encourage you to keep this market shift in mind. While Covid-19 may slow a rapid increasedue to the practical problems of visiting properties, it will not eliminate the underlying demand which has been pent up for a couple of years. Even with the slowing effect in the last half of March, the composite benchmark price for all residential properties in Metro Vancouver at the beginning of March was $1,033,700, a 1.3 per cent increase from February.  Broken down to each property type, there month-over-month increase across the board: 1.2 per cent increase for detached homes; 0.9 per cent increase for townhouses; and 1.4 per cent increase for condominiums. In the comparative benchmarks below, you can see that prices in the past month far exceed the number of decreases.  

 Detached Homes

The benchmark price for a single-family detached home in Greater Vancouver at the end of March was $1,450,700, an increase of 1.2 per cent from the preceding month. The extremities of this average were Vancouver West (not West Vancouver) at $2,942,200 and Maple Ridge at $835,100. The three municipalities closest to the benchmark on the higher side of the average were: Burnaby North at $1,453,100 an increase of 2.4 per cent from the preceding month; Burnaby South at $1,493,500, an increase of 1.1 per cent from the preceding month; and Richmond at $1,522,800, an increase of 0.9 per cent from the preceding month. The three municipalities closest to the benchmark on the lower side of the average were: Vancouver East at $1,426,500, an increase of 1.3 per cent from the preceding month; Port Moody at $1,420,300, an increase of 0.6 per cent from the preceding month; and Vancouver East at $1,225,300, an increase of 2.5 per cent from the preceding month.  

Townhouses

The benchmark price for a townhouse in Greater Vancouver at the end of March was $791,800 an increase of 0.9 per cent from the preceding month. The extremities of this average were Vancouver West (not West Vancouver) at $1,133,500 and Maple Ridge at $535,100.  The three municipalities closest to the benchmark on the higher side of the average were: Richmond at $795,000 an increase of 1.4 per cent from the preceding month; Vancouver East at $893,300, a decrease of 1.2 per cent from the preceding month; and Vancouver West (not West Vancouver) at $1,133,500, an increase of 0.2 per cent from the preceding month. The three municipalities closest to the benchmark on the lower side of the average were: Burnaby South at $768,400, a decrease of 0.6 per cent from the preceding month; New Westminster at $749,000, an increase of 0.7 per cent from the preceding month; and Burnaby North at $727,700, no change from the preceding month.

Condominiums

The benchmark price for a condominium in Greater Vancouver at the end of March was $687,000, an increase of 1.4 per cent from the preceding month.  The extremities of this average were West Vancouver at $1,027,600 and Maple Ridge at $359,700. The three municipalities closest to the benchmark on the higher side of the average were: Burnaby East at $678,900, an increase of 4.8 per cent from the preceding month; Vancouver West (not West Vancouver) at $810,800, an increase of 1.9 per cent from the preceding month; and West Vancouver at $1,027,600, an increase of 1.4 per cent from the preceding month. The three municipalities closest to the benchmark on the lower side of the average were: Burnaby South at $674,900, a decrease of 0.5 per cent from the preceding month; Port Moody at $671,900, an increase of 3.8 per cent from the preceding month; and Richmond at $655,200, an increase of 2.3 per cent from the preceding month.   

Let me help

I am working hard to help my clients during this challenging time. I know many of you want to find a home while prices are still within your budget; if you need help navigating the new rules for eased mortgage stress testing; or if you are looking for the best mortgage for your financial capacity, please give me call. There is a lot we can do online and by telephone. I encourage you to visit my website for an extensive list of properties, prices, and areas. Together we can meet the challenges we are facing with COVID-19 and still manage your housing needs.   

Please don’t hesitate to give me a call. (604) 779-7992

Thanks for reading!

Sibo Zhang, REALTOR®


Labour Day and the Start of the School Year

Our Labour Day holiday this year is on the third day of September. For some reason I’m used to our annual Labour Day holiday coming about week later. It’s a bit of a shock to me, because the Labour Day holiday weekend is a family’s signal that summer vacation is over, and school is about to start. Some are returning to the city after a vacation at their summer cabin, while others are navigating the traffic in the city streets chasing about the stores and malls for all things their kids will need to start the school year. It’s a busy weekend for everyone each year, and when it arrives so suddenly after the end of August, I guess I just miss a longer transition week into September. That allows me mentally to prepare for the resumption of another schedule that revolves around our children’s education, a kind a week when we can all take a deep breath and say, “another year has gone by. Wow.” It comes with that mixed emotion of sadness at summer’s end and excitement about the new season coming along. It’s curious how family life ties its real year-end to the school year. But still, I like it starting about a week later than it does this year.

Labour Day itself is a federal holiday set by law as the first Monday in September each year. Obviously, that means it moves to different date each year, but if there’s any politician out there who might be willing to make a change, he or she will have my support. I would rewrite the Labour Day holiday to be observed as: the first Monday in September, except when the first Monday is one of the first six days of the month, in which case the holiday will be observed on the closest weekday to the seventh day of the month. There, not too complicated. I think that should ensure that we get a week at the beginning of each September to transition from the summer vacation to school year mode of activity. And just in case you’re wondering, next year Labour Day falls on September 2nd so it will arrive with even greater abruptness than this year. By 2020, however, it’s back to a reasonable date of September 7th, just where I like to see it.

Of course, Labour Day doesn’t have to be the holiday that ends our summer vacation period. In fact, I wonder how many people can actually name the holiday. I think a lot of folks would just refer to it as the September long weekend before school starts. That might not be very good citizenship because Labour Day is an important tradition not just in Canada but around the world. It recognizes the hard-working people of all countries who for many years in another age were under-represented in their rights and under recognized for their contribution to the economic life of society. But in many countries the annual Labour Day holiday is May 1st, which is known around the world as International Workers Day. This might cause some commotion though, because May Day, as it is also known, has its historical roots as a celebration in some communist countries. It could come across as a revision of the 19th Century revolutionary slogan of the philosopher Karl Marx: “Workers of the World Unite” – updated now to “Worker’s Holiday of the World Align.” I don’t really think there’s much chance of that, and besides, Canada has its current Labour Day holiday aligned with the same holiday weekend in the United States, so that also makes it possible for family members living in the neighbouring countries to get together at the end of the summer. But I’m will bet that a lot of families in the United States would agree with me that when the holiday arrives so early in September, they would also like to delay it for a few more days. Maybe I can get an international movement going to support my cause!

In any event, I want to wish all of you, my friends, clients, and casual readers, a happy start to the real new year for families with school age children. It all changes after the Labour Day long weekend.

Thanks for reading!

Sibo Zhang, REALTOR®
Heat and Smoke: Some Tips to Cope

Between extremely hot weather a bit earlier this month and smoke-filled air in the city during the second half, it’s hard not to think that the effects of climate change are being realized even more rapidly than predicted. That’s a big question that I don’t want to presume to know the scientific answer to, but I can provide some space in the blog on some practical advice to deal with these issues. For most of us we can take some common-sense approaches that will help us, but let’s remember that there are others who may need our help, or at least a bit more attention to their well-being. I’m speaking of course about seniors and children.

Let me go first to some tips for dealing with extreme heat. It’s important to take some precautions so you don’t get over-exposed, dehydrated, or worse, faint-headed. I’ve garnered a list of tips from various reliable sources on some of the things you can do to protect yourself, your family and your pets extreme heat.

The Red Cross advises people to take the following steps when it’s extremely hot outside:

  • Never leave children or pets in your vehicle. The temperature inside can quickly reach over 30 degrees Celsius which is dangerous.
  • Keep hydrated. Drink lots of fluids – water is recommended – but avoid caffeine and alcohol.
  • Be careful when entering or leaving air-conditioned buildings; wear a sweater of jacket inside if it is extremely cool in contrast to outside.
  • Wear loose fitting, lightweight clothing outside in the extreme hit. Light colors are better. Dark colors absorb the sun’s rays.
  • Don’t rush. Slow down and don’t engage in strenuous work in excessive heat. Also avoid vigorous games in the heat.
  • If working in the heat, use a buddy system and take frequent breaks.
  • Check on your friends and neighbors, especially if they don’t have air conditioning.
  • Check on your pets frequently, Keep them in shady or cool places, and make sure they have plenty of cool water.

If you don’t have air conditioning, try public places that may offer cool surroundings like libraries theatres and malls.

Now some tips for coping with poor air quality. This is very important for anyone who may suffer from conditions such as asthma, diabetes or heart problems. It is also important for pregnant women, infants, and young children as well as the elderly to take extra precautions with wildfire smoke in the air. B.C.’s Coastal Health has some good tips which I will summarize for you here:

  • Try to reduce your physical activity. When you breathe hard you inhale more smoke.
  • Find a cool place and drink plenty of water, just as you would for extreme heat.
  • If you or someone you care for suffers from asthma or other breathing difficulties, be sure you have appropriate medications on hand.
  • Put off outdoor activities that you don’t need to attend or participate in.
  • Take advantage of air-conditioned areas like malls, libraries and community centres.
  • There are portable air cleaners that use HEPA filters. These are especially good at removing smoke from indoor air spaces.
  • Keep your windows and doors closed if possible. If a breeze is needed on a very hot day, try to limit the amount of time your window is open so you don’t let in too much smoke filled air.
  • Finally, Coastal Health advises you to check the Air Quality Index (AQI) regularly. You can use it to determine which actions you should undertake under different air conditions. There is also an Air Quality Health Index (AQHI) Canada app that will notify you when air quality changes.

As always, stay safe and please enjoy the rest of your summer!

Thanks for reading!

Sibo Zhang, REALTOR®

Rainy Days By The Numbers

Rainy days by the numbers In case you haven’t noticed, it’s been raining a lot lately! That’s not a surprise in Vancouver. We’re used to long stretches of rain (and sometimes some snow) from around November to April each year. About this time every year, those warm sunny beach holidays in another country start looking very enticing.

Yet, according to measurements in Vancouver last year, it was March that had the most precipitation with 199.4 millimetres. It wasn’t until November that we got close to that again with 194.8 millimetres. It was newsworthy when November 2017 was recognized for its 27 days of rain out of 30 days, which tied it for the most days of rain in any month since 1953. The summer months were quite low in contrast. June had 46.4 millimetres and then the rain dropped dramatically in July and August to 1.8 millimetres and 5.0 millimetres respectively. Back to the present, however, this January has been very rainy, As of January 19, this month’s precipitation, measured at the sea level in Vancouver’s Coal Harbour, was already at 115.4 millimetres, significantly higher than all of January 2017 at 98.8 millimetres.

You may be someone who thinks about the number of rainy days rather than the amount of rain that actually fell. In that case, here’s a tabulation of the number of days in 2017 with rain fall over four different thresholds.

It’s noteworthy, though not surprising, that the greatest number of rainy days are those above 0.2 millimetres. This is evidence that our sense of that long stretch of rainy days from November to April is correct, but we should also note that the amount of actual rain each day is typically quite low. And the number of really heavy rain days is also quite low.

I think many people will find this to be counter-intuitive – especially this year, when it seems like almost every day is one of heavy rainfall. Perhaps this is a good reason to remind ourselves that our perceptions of rain can be emotionally influenced. So, it worthwhile to check the actual statistics occasionally. It’s a good reality check.

Over the past 25 years, annual precipitation in Vancouver has almost always exceeded 1,000 millimetres. Data collected by Environment and Climate Change Canada show only three years below that amount: 1993 with 837.0 millimetres; 2002 with 857.6 millimetres; and 2013 with 944.0 millimetres. It’s interesting that the lower volumes are increasing as we go forward, but is it a trend? Something to watch I think. For the years above 1,000 millimetres, the precipitation volume in 2016 was the highest at 1,356.8 millimetres. Close behind that was 2007 with 1,322.4 millimetres; 2014 had 1,276.3 millimetres and 2017 had 1,239.3 millimetres. There are a lot of ways to measure rain.

These statistics from Environment and Climate Change Canada are a great way to slice and dice the weather. As I have often mentioned, I like to analyze things statistically, but sometimes it’s also good just to use your basic intuition. For example, I was not able to find any statistics that correlated the amount of rain with a wind factor. With this correlation I think we could also develop a rain wetness index that is similar to what is called a chill factor. Meteorologists have devised the chill factor to indicate how cold it “feels” when you combine the wind and the temperature. So why not a rain wetness factor that would indicate how wet you get when the rain is blowing on you? For example, a heavy downpour in a 40-kilometre per hour wind might be the same rain wetness factor as light rain in an 80-kilometre per hour wind storm. Imagine the calculations you could do! Maybe that will help keep your mind off the rain.

I send you warm and cheery wishes during these rainy and grey winter days.

Thanks for reading!

Sibo Zhang, REALTOR®

Living and Investing in Surrey

In my last blog, I referred to a recent report from the Real Estate Investment Network (REIN) which ranked Surrey in the top 10 cities in British Columbia. That’s a major endorsement for Surrey when it comes to deciding where you want to invest in a home and raise a family! And when a city gets known for something like that, its reputation escalates as everyone gets even more excited about what they’ve got.

You can be certain that purchasing a home in Surrey is truly an investment, and an exceptionally good one. My wife and I are raising our family here and we couldn’t be happier. I had to dedicate my entire last blog to the multitude of events here just for youth. In this post I will try to balance the scale a bit in favour in why Surrey is great place for adults too; and of course having a great choice of things to do together with your children is also one of the biggest rewards!

Let’s begin with a theme that is the hallmark of living everywhere in British Columbia – the great outdoors! Surrey has preserved some of the most beautiful areas for parks – and the City’s Parks Board has developed breathtakingly beautiful parks. In fact, there are so many parks in Surrey I would have to publish a book to mention them all. The City of Surrey’s website says there are 200 parks here, but if you count all the greenbelts and nature areas, there are over 600 sites according to British Columbia tourism ministry. I have gone to a tourist website, Trip Advisor Canada, and the British Columbia’s Tourism website to narrow the list to 10 of their top picks (just to be impartial). I’ve started in South Surrey and picked some great parks and nature preserves moving northwards.

There are beautiful parks with unique programs in every one of Surrey’s neighbourhoods.

i) Crescent Beach

This spectacularly beautiful area is the perfect place for a walk along the ocean or taking in a sunset on the western horizon.

ii) Redwood Park on 20th Avenue

This beautiful forest has lots of trails for exploring, and the park has lots of fun things for kids too, like a playground keeping with the Redwood theme of the park, and “fairy houses” along the main trail.

iii) Blackie Spit Park at 3135 McBride Ave

This area is also on the ocean coast and is a great place to walk with kids, or you can walk your dog on leash. For the more adventurous, it’s also a great place to launch a kayak and a paddle the coast line.

iv) Urban Safari Rescue Society at 1395 176 St.

Even if you don’t like lizards, spiders, snakes, turtles, and all sorts of bugs, then I’ll bet your kids do! This place isn’t exactly a park, but for nature it’s a great place to learn about all those interesting creatures that children are curious about.

v) Unwin Park in the Newton Area

Large 36-acre community park with a host of different activities for the whole family. Check out the baseball diamonds, batting cage, cricket fields, soccer fields, lacrosse boxes, and even a basketball court.

vi) Green Timbers Urban Forest at 4600 Block of 100th Ave.

My family loves this place. It’s a tranquil and quiet park off the Fraser Highway near King George Boulevard. You can go biking or for lovely walk along a beautiful pond. There is lots to do here for adults or children.

viii) Bear Creek Park at 13759 88th Ave.

A great place to entertain young children. There is the Bear Creek miniature train, a waterpark and outdoor pool to cool down in the summer or you can play mini-golf or hike along the trials.

ix) Fleetwood Park in the Fleetwood area

This is a perfect place for picnics and play areas (including a spray park) to scenic gardens and nature trails.

x) Guildford Height Park

This is a 16-acre park near Guildford town centre, two blocks east of the Guildford Mall. Its games court and multi-use grass field is perfect for a game of pick-up soccer of frisbee.

Now, let’s take depart from the great outdoors and take a quick look at what Surrey offers for arts and cultural activities. There is already an abundant appreciation of the cultural activities that make for a vibrant community life in Surrey. Here are just a few examples of the kind of investments the City has made to ensure a enhanced cultural and artistic community is appreciated and enjoyed.

The Surrey Arts Centre at 13750 88 Ave. is like a one-stop shop for visual and performing arts. It is the arts hub for the Surrey Art Galley and the Surrey Civic Theatre’s Main Stage and Studio Stage Theatre. Here you can discover contemporary art through changing exhibitions, permanent artworks, and free events like tours, talks and art-making opportunities. Or you can watch actors, dancers and musicians perform on stage. You can even explore your own creativity through the many art and performing arts classes offered here. In the Newton area, the Arts Council of Surrey has turned the old Firehall into its new headquarters. Named the Surrey Cultural Centre, it is a thriving centre advancing arts appreciation in the heart of the Newton in Surrey. This is just a small sample of what has already started in Surrey’s cultural life. The City is committed to developing its arts and cultural communities. In 2011, Surrey adopted a broad framework – The Surrey Cultural Plan — to enhance the City’s ability to effectively mobilize the resources and talent available within the community towards a sustainable, dynamic, and socially cohesive city with an enviable quality of life. These are just a few of the factors that contribute to Surrey’s making the top 10 list in the REIN report.

You can see that choosing Surrey as place to raise your family is indeed smart investment in the future!

Thanks for reading!

Sibo Zhang, REALTOR®


*image via www.surrey.ca

Metro Vancouver/Fraser Valley Market Update, November 2017

November has announced that Winter is just around the corner. The noticeable drop in temperature is a good reminder to get prepared for the coming season; snow tires, Christmas decorations, maybe a short holiday to a warmer region. There are lots of things to do before winter rolls around.

Metro Vancouver

Another noticeable thermometer change of a different sort this November – with importance for home shoppers – was the big jump in residential sales last month. The Real Estate Board of Greater Vancouver reported that October’s sales volume was 7.1 per cent higher than September’s, and a huge 35.3 per cent higher than one year ago. In fact, last month’s sales volume was 15 per cent higher than the 10-year average for the month of October. However, there’s one prominent figure that has remained almost unchanged from last month – and very close to what it was this past summer: the composite benchmark price for all residential properties in Metro Vancouver. My monthly newsletter readers have been following my review of this benchmark price since it surpassed the $1-million mark in July this year. Since then, its rate of increase has really slowed down – a psychological threshold I have speculated – with the October price of $1,042,300 a mere 0.5 per cent higher than the preceding September bench mark price. And what is particularly interesting is that this rate of increase is exactly the same as the rate of decrease for the benchmark price of a detached property ($1,609,600) in the same month-over-month period. Now, that may well be just a curious coincidence, but it makes one suspect a hidden inverse correlation between detached properties and other types of residences in the current market. In other words, are homebuyers shifting from one housing type to another at this price level? If so, this would support my hypothesis of a price threshold for detached homes; and there was a similar increase in sales activity for both townhouses and condominiums in October.

The October benchmark price for apartments increased 1.0 per cent from the September 2017 price, to reach $642,000. The benchmark price increase for townhouses for the same period was 2.0 per cent, reaching $812,400. These prices are still attracting a lot of buyers. The inventory of available properties in Metro Vancouver in October was 9,137, a decrease of 3.5 per cent from September. Below I have selected some areas where the benchmark prices (as of October 2017) for apartments and condominiums – the market segment of interest to most of my clients – are currently recommended for viewing.

For apartments, I have selected four areas that are closest to the Metro Vancouver benchmark price of $642,000. Each of these areas has its own benchmark price above $600,000, providing prospective buyers with similar property characteristics in the same price range but in distinctly different geographical locations. As usual I have also indicated the most recent rate of price change from the preceding month. You can then narrow your search according to your preferred area to live. In South Burnaby the benchmark price was $664,200, which was the same price in the preceding month; in Burnaby East, where the benchmark price was $661,100, with a decrease of 3.1 per cent from the preceding month; in Port Moody, which had a benchmark price of $613,399 and a 2.0 per cent increase from the preceding month; and Richmond, where the benchmark price was $609,600 with a 1.6 per cent increase from the preceding month.

For townhouses, the benchmark price for Metro Vancouver was $802,400. I have again selected four areas closest to this price, excluding Whistler and West Vancouver because they are each over the $1-million threshold, and Squamish at 899,900, simply because most of my clients are looking for something closer to Vancouver. The four remaining areas are: North Vancouver at $977,000 with a 1.3 per cent increase over the preceding month; Vancouver East at $855,200 with a 0.2 per cent increase over the preceding month; Richmond at $800,000 with a 0.2 per cent decrease over the preceding month; and Burnaby South at 762,300 with a 1.9 per cent increase over the preceding month.

Fraser Valley

If you are in the market for a townhouse or condominium, the Fraser Valley is where I have been directing my readers for value properties at prices that are still within the range of first-time buyer budgets. Certainly, I can help you find a detached property if that is what you are after. The benchmark price in October for a single family detached home was $971,900, which is close to the benchmark price in Metro Vancouver, but still under the $1-million mark. So, if the same pattern holds for price increases as discussed above, the rate of increase may start slowing down soon. It will be interesting to watch if this pattern holds in the Valley as it has done in Metro Vancouver. However, the major sales focus in the Valley is still in the market segment for attached properties. This typically offers what young families are looking for in a townhouse, or for young singles just starting out with a condo. This is an excellent strategy for your longer-term living plans because you start building equity in owning a property. As your family may grow, and your work career develops, you will be in market in which you can move up in value if you like. This is a much more desirable position to be in than trying at a later stage to get into a market that is relentlessly pushing upwards in value.

But there is only one way to describe sales activity in the Valley – it is hot! This past October saw overall sales reach the second highest level in history, with an increase of 23 per cent over October 2016, and 11.1 per cent higher than September 2017. The attached sales were 56 per cent of all market activity with sales of condominiums reaching 591 units and townhouses at 418.

The October benchmark price for a Valley townhouse was $502,800 and for a condominium, $369,400. I have again selected some areas where I see some very good value at prices that are in the affordable range for my clients. I hope you will find the following selection a useful guide in your search for what you want. Each of my selected areas is as close possible to the benchmark price while remaining in the $500,000 range with the $100,000 increment for each benchmark price. I have also included the last month’s rate of change in the price for that area.

For townhouses, the October Valley benchmark price in North Delta was $579, 300 with a 0.8 per cent increase over the preceding month; Cloverdale at $562,700 with a 0.4 per cent increase; Surrey at $540,300 with a 1.2 per cent increase; and North Surrey at $510,600 with a 0.8 per cent increase.

For condominiums, the October Valley benchmark price in Langley was $379,100 with a increase of 2.9 per cent increase over the preceding month; Surrey, at $364,200 with a 3.8 per cent increase; North Surrey at $354,800 with a 3.2 per cent increase; and North Delta at $345,100 with a 3.6 per cent increase.

Please let me know if I can help you with any specific market questions. I am more than happy to crunch the numbers that can help you make the best decision for your home buying plans.

Thanks for reading!

Sibo Zhang, REALTOR®

Halloween Is An Evolving Celebration


Halloween is approaching – a favourite date for kids, and a lot of adults too, to dress up and make believe. My two boys love thinking about what they will “be” on the evening of October 31. Maybe a witch, a ghost, or a fairly tale prince or princess. Sometimes kids want to imagine a future adult job when they grow up. One year our oldest son went trick-and-treating dressed as a policeman. I’m glad he was thinking of a lawful occupation. (It was my neighbour who wore a prisoner costume and let my son keep him under arrest while going door to door for free candies).

I think it’s a great time for kids and parents to enjoy a harmless and fun time, but like any event in our modern, multicultural country, it needs to treated in a way that fosters our children’s sense of community, and avoids costumes that can cause hurt to others. Sometimes this is inadvertent, simply because many costumes on sale in stores are throwbacks to a period of history when they were worn simply to be different. Today, they may cause offence because we now realize they may represent something sacred or otherwise sensitive part of another person’s religious or cultural heritage. Globe and Mail writer Elizabeth Renzetti had a good column recently about this entitled Offensive Halloween Costumes Should Go to the Grave. (October 14, 2017). Renzettti points to headwear such as turbans or feathered headdresses as such examples.

Of course, if you look at the history of Halloween you understand this peculiar celebration has its roots in ancient cultural and religious beliefs. This also provides a lesson for modern folks. We should try to understand how celebrations like Halloween can evolve, and how a multicultural nation like Canada has a unique opportunity to continue the transformations that occur in its evolution – a learning experience that has value for adults and children alike. I found it very interesting to learn that Halloween actually had its origins in an ancient Celtic festival called Samhain. This dates back 2,000 years ago when the Celts, a people living in what is now Ireland, Britain and northern France had a festival on November 1st, which was their New Years Day. The Celts had a religion with Druid priests who believed the ghosts of the dead ancestors returned to earth on their New Year’s eve. Hundreds of years later, when the ancient Roman empire had conquered the Celtic lands, the annual festival came to include honouring the Roman deity Pomona, the goddess of fruit. Today, our Halloween activities for kids often include “bobbing” for apples, (trying to take a bite of apple while it floats in a tub of water), which we can connect to this ancient Roman aspect of the festival. Then, hundreds of years after this period, when the Christian religion through the Roman Catholic Church was dominant in the empire, the celebration blended the Celtic belief of the returning souls with the Church holiday of All Souls Day. This saw people dressing up as angels and devils.

The modern idea of “trick-or-treating” from house to house appears to have its origins in later celebrations of Halloween when poor people were given pastries called “soul-cakes” – a possible reference to earlier times when food was in short supply during the winter, the start of which was Halloween. This may have been the beginning of our modern celebration when kids go door to door for candies, apples, and other goodies.

Since my wife and I have come to Canada from China, we also want to teach our children about their Chinese heritage. We’re looking forward to seeing dragons and other Chinese icons also becoming part of Halloween festivities. We love raising our two sons in this exciting multicultural country!

Check out some of the fun, family-friendly activities happening in Surrey for Halloween this year, here.

Thanks for reading!

Sibo Zhang, REALTOR®

Sibo’s Market Update for Metro Vancouver / Fraser Valley Sept. 2017


Let’s start this month with something curious that appears to be happening in the detached home market in Metro Vancouver. You may recall last month when I reported the Benchmark price for a residential property had surpassed the $1-million mark for the first time in July. I said then that this may have created a psychological attitude from a buyer’s point of view, where many home hunters make the decision to look at another market segment, either townhouses or condominiums. This month I can tell you that’s precisely what is happening. But it remains to be seen if I was completely correct or only half right on the whole equation. While there has been a clear spike in sales of townhouses and condominiums, my prediction was that detached family homes would rise in price at a rate faster than before the $1-million threshold. This latter speculation has not yet happened, although it’s too early to detect a trend. The Benchmark price for a detached property in August was $1,615,100, which is only a 0.2 per cent increase over the preceding month. The increase from June to July was 2.1 per cent so for the time being anyway, the detached home price appears not to be escalating. This might be for various reasons, but for anyone wanting to get into a detached home, they should probably move quickly. It’s a safe bet that the price in the Metro Vancouver is not going to decline. What may be keeping the rate of increase this low is an unexpected increase in the supply. Compared to August a year previous, sales of detached homes were nearly 23 per cent higher this year. It may well be that a segment of sellers also held the $1-million mark as their selling point, so I will stick with my longer-term prediction that the rate of increase will pick up once this segment clears in sales.

Metro Vancouver

Looking at the rather hot Metro Vancouver market in August for attached properties, the Benchmark price for a townhouse was $778,300 and for a condo, $626,800, compared with the previous month at, $763,700 and $616,600 respectively. You can see that prices are moving up quickly in this market segment so I have analyzed for you here some areas you may want to check out. I have selected a Benchmark price range for August from the low $600,000s to the low $700,000s combined with areas with lowest month-over-month rate of increase. I think this may be good guide for a large segment of my clients.

For townhouses, Port Moody was at $608,700 with a last month rate of increase of 1.9 per cent. For New Westminster: $652,700 with a last month rate increase of 0.9 percent. For the top of my selected range I am using two areas close in both geographical location and price: Tsawwassen ($720,100 with a negative last month rate of increase of 0.9 per cent) and Ladner ($733,900 also with a negative last month rate of increase at 0.6 per cent). While a single month does not itself show the rate of increase will remain low in the long term, in these cases I think sit is reasonably good indicator of greater price stability than some other areas.

For condominiums, I have selected a Benchmark price in a range from the low $400,000s to the low $500,000, again combined with lowest last month rate of increase. Port Coquitlam was at $412,200 with a last month rate of increase of 2.8 per cent. Coquitlam was $476,900 with a last month rate of increase of 3.8 per cent. New Westminster: $480,000 with a one-month rate of increase of 2.8 per cent. And Vancouver East at $529,000 with a last month rate of increase of 0.9 per cent. As with townhouses, the single month rate of increase is not a long-term predictor, but I think it’s a reasonably reliable indicator for price stability for at least the short term.

Fraser Valley

I’m betting September will be month that the Fraser Valley Composite Benchmark Price (CBP) for a residential property goes over the $1-million mark, as it did in Metro Vancouver in July this year. If you’ve been following my contest, I have been offering a prize to the person who guesses closest to the CBP over $1-million and the month in which it will occur. The CBP for a residential property in the Fraser Valley for July was $966,000. To reach $1-million would require a 3.6 per cent increase over July, which is a big jump for one month. I think it will take two months and if I’m correct we’ll see that when the September statistics are out next month. So, this may be your last chance to make a guess and win a customized Comparative Market Analysis (CMA) of your current property. Each CMA is an estimate of the owner’s house value using its condition, location (neighbourhood study), real estate market study, and recently sold homes in the same area. Send me your guesses (sibo@sibozhang.com) by the end of this month (September 2017). Our winner(s) will be announced in a coming newsletter and on my website. Be sure to include your name and phone number so we can collaborate on your CMA.

The Valley saw, once again, a high demand for townhouses and apartments in August. The Benchmark Price for a townhouse as $491,900 in August, a one month increase of 1.0 per cent over July. For apartments, the BP was $349,300, a one month increase of 2.4 per cent over July. I have many clients wanting to find a quality attached residence in the Fraser Valley so again this month I have selected some areas with an affordable price range.

For townhouses, a price range that many young families are looking for is from the mid-$300,000s to about $500,000. Along with these Benchmark Prices (BP) I have also included the last month rate of increase so you can get a basic idea of the market activity there. For the least expensive townhouses you would have to go as far out as Mission where the BP in August was $392,500 with a 3.0 per cent last month rate of increase. For Abbotsford: $340,500 with 1.9 per cent last month increase. For Langley: $464,500 with a 0.7 per cent last month rate of increase. For North Delta, $501,000 with a 0.6 per cent last month rate of increase. As you can see, the BP rises as you get closer to Metro Vancouver.

For apartments, I know many young people are looking for a residence that is affordable within a starting salary range, so I’ve selected areas with a range of August Benchmark prices from the $200,000s to the mid-$300,000s. This time the least expensive is in Abbotsford at $259,800 with a 1.4 per cent last month rate of increase. Next in price is Mission at $273,200 with a last month rate of increase of 1.5 per cent. North Delta is $324,100 with a last month rate of increase at negative 0.4 per cent. North Surrey at $333,900 with a last month rate of increase at 3.0 per cent. And Surrey at $345,900 with a last month rate of increase at 0.4 per cent. You may have noticed the difference from townhouse prices here, as the least expensive apartments are not necessarily the farthest from Metro Vancouver.

image via biv.com

Thanks for reading!

Sibo Zhang, REALTOR®

 

Pattullo Bridge pt.2 – The Bell Shaped Curve

In my last post I talked about the repairs needed to keep the Pattullo Bridge open until a new replacement bridge is built. Now I want to point out my favourite design feature of the existing bridge in the hope that the architects and engineers of the new bridge will keep this one feature.

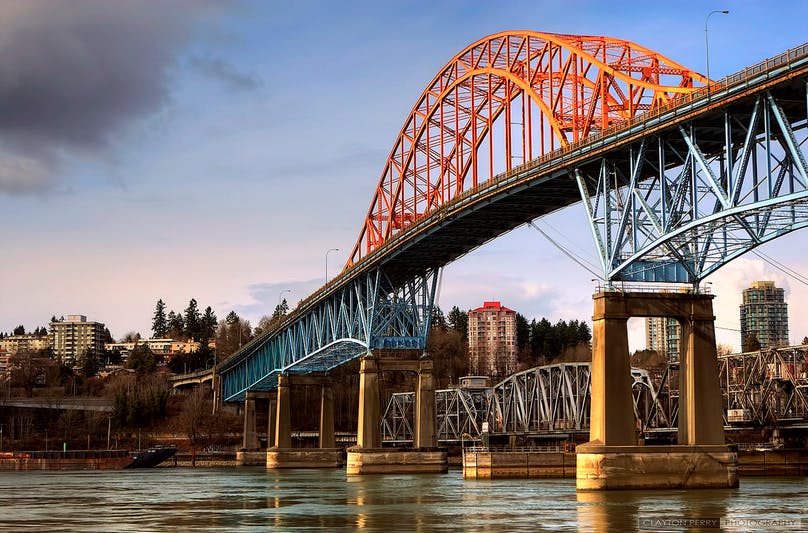
The feature is the “Bell Shaped Curve” displayed in the orange-coloured iron structures on the sides of the bridge at its crest, or basically the centre part of the Bridge. You get a great view of this when you are on the Skytrain crossing the Fraser River between New Westminster and Surrey.

The Bell Curve has special significance for me because of my formal training in statistics. If you read my monthly newsletter you will have noticed that I often discuss benchmark prices in the residential market, and other average prices. So, what’s this got to do with a bell shaped curve? Quite a lot, actually. You see the Bell Curve is really a graphical representation of data. In Real Estate, the data can be residential prices. When you have a high number of price values they may show up in a Bell Curve. If you imagine a vertical line dividing the Bell in half, that would be the average price of the values on the left and right sides of the Curve. This average is also called the Mean. You can see the curve is symmetrical on both sides of the line dividing it in half. The values under the top of the curve are negative on the left side and positive on the right side, therefore creating the mean average in the middle.

The Bell Curve is considered a beautiful thing in pure mathematics. It applies to lots of different kinds of groupings in society and in nature. It shows up when you have lots of data in the thing you are studying. One of the really interesting things about it is that in every Bell Curve most of the data falls under the highest (central) part of the Curve. Then the next largest grouping falls under the next lower part, so that each successive smaller part causes the curve to get closer and closer to its lowest point. Each of these symmetrical groupings around the mean average is called the standard deviation from the mean.

In statistics, another name for the bell shape is Normal Distribution. Here is the more precise thing about that interesting data pattern called the standard deviation. In a normal distribution, approximately 68% of values are always within the first standard deviation from the mean; then within two standard deviations from the mean there are always about 95% of the values. and about 99.7% are within three standard deviations.

In a Real Estate market, the standard deviation could be a group of housing prices on either side of the average price. When the standard deviation is a short distance from the average price (centre line), the bell shape is higher and more pointed at the top. When the standard deviation is longer, it is a lower bell shape like the Pattullo Bridge’s curve. So you can understand now how the number of values that we have in the data can affect whether the Bell Shape is high or low.

Now take a look at a closer look at the Pattullo Bridge’s Bell Curve iron works. Look carefully at the tail end on the outer curve. The inner curve attaches more or less straight down onto the bridge, but the outer curve extends in a horizontal manner which gets very close but does not actually meet the flat part of the bridge (actually, it’s fastened to the bridge for practical purposes, but you get the idea). That’s the area that get’s very close but never quite meets the bottom. This is the tail end of the curve that extends to account for the tiny percentage of data beyond the 97.3 per cent in the third standard deviation. It’s under that small space where “outliers” are located. As the standard deviations get farther from the mean average, we approach the outliers in the tails of the curve. It’s in those tails that I am always looking for special real estate deals.

So please, keep the Pattullo’s Bell Shaped Curve in the new replacement bridge scheduled to be ready in 2023. It has a great deal of symbolic significance in Canada’s fastest growing residential market.

Thanks for reading!

Sibo Zhang, REALTOR®

image via www.translink.ca

Coming Soon! HUGE 1 bedroom in the Observatory!

#606 – 10899 University Drive, Surrey BC

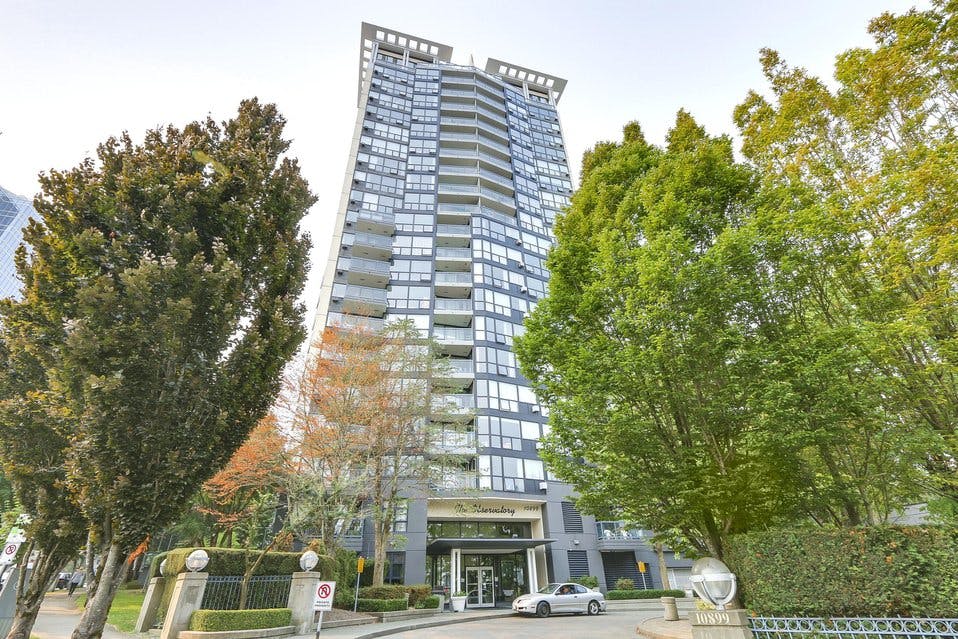
Coming soon to MLS! Welcome to the Observatory – Surrey’s concrete high-rise 1 block from the Gateway Skytrain. This HUGE, North-East facing 1 bedroom unit boasts mountain, river, AND city views! Everything you need within steps – access Downtown Vancouver in less than 40 mins, steps to Chuck Bailey Recreation Centre and Whalley Athletic Park, and shopping centre to be completed right beside Gateway Sky Train Station. Facilities include exercise room, sauna and hot tub.

Listed at $269,900. Bring your offer today. This deal will not last long!

Open House Saturday Aug. 19 and Sunday Aug. 20 2-4PM

Call Sibo with your questions: (604) 779-7992