fraser valley market update

April’s Market Update for Metro Vancouver and the Fraser Valley

OUR CURRENT RESIDENTIAL MARKET

As we move into the second quarter of 2018, I’m sure everyone is looking forward to more sunshine and fewer rainy days. The weather can be a factor in our outlook and affect our decision-making even on major transactions like buying or selling a residential property. That’s a good reason to pay close attention to some key market trends occurring in local prices and inventories. With so much recent news on new government regulations and taxes on property, it’s easy to develop negative views that are not wholly informed by the facts of the marketplace. Another thing that can contribute to unnecessary pessimism is an over-emphasis on longer term historical comparisons. Regular readers of my monthly newsletter get a picture of the marketplace which is as up-to-date as available statistics make possible, allowing them to understand the where and why of prevailing prices in a context that is relevant to current circumstances. I will continue to breakdown the market segments for each property type in the following geographical regions of Metro Vancouver and the Fraser Valley.

METRO VANCOUVER

In the past month of March there were total of 4,450 new listings in Metro Vancouver which was increase of 5.4 per cent over the preceding February. That’s good news for the active home seeker; yet, it’s fewer than the 4,762 listings that occurred in the same month one year ago. The latter statistic might be of interest in broader academic analysis of the Vancouver residential market, but it’s probably not going to affect a decision to buy or sell at the current time because the prevailing market psychology doesn’t believe that prices are going to move backwards in time. 00 For that reason, I am always talking to my clients to understand what they really want to know for the decisions that are important to them. And what I hear is that you wish to know about what is happening now, and in a context of what it points to in the near term. So here are my selected key metrics based on market activity tabulated on the end of last month.

Across all residential property types in Metro Vancouver there were 2,517 sales at the end of March. This was 14 per cent higher than the preceding month of February, so we can see there is still upward pressure on based on demand and the relatively low increase in new listings. At the end of March, the total inventory of listed homes in Metro Vancouver was 8,380. Breaking down the demand in each property type, we see 14.2 per cent for detached homes; 39.9 per cent for townhouses; and 61.6 per cent for condominiums. The composite Benchmark price for all Metro Vancouver residential properties at the end of March was $1,084,000, an increase of 1.1 per cent over one month. Below I will look at each property type in more detail.
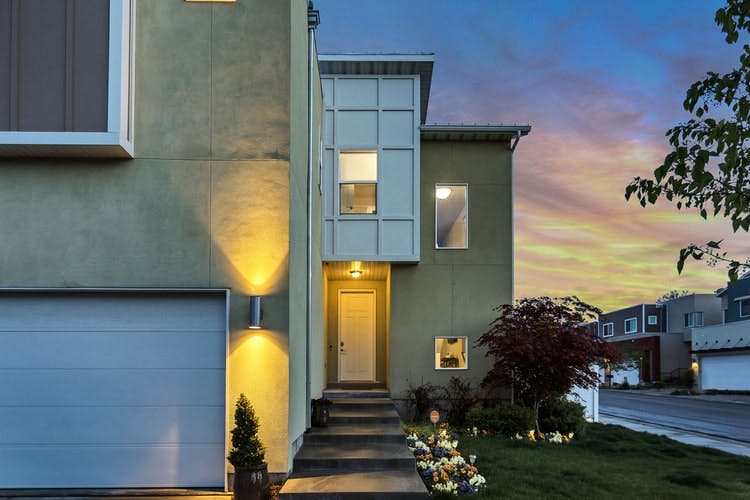
Detached Properties

The Benchmark price for a detached residential property in the Greater Vancouver area at the end of March was $1,608,500, more than half a million dollars above the composite benchmark price for the region. This may give you an idea of a general price level. However,it needs to be considered in relationship to the property types factored into the composite benchmark, which we can look at under their individual headings below. For Single Family Detached homes, the Benchmark price is an average between price extremities of $3,449,000 in Vancouver West (noteworthy: higher than West Vancouver at $3,115,400.) and $606,000 on the Sunshine Coast. I have selected three municipalities closest on the upper side of the Benchmark, and three which are closest on the lower side, where you can see the price change in the past month. On the higher side of the Benchmark were South Burnaby at $1,673,700, a decline of 0.5 per cent in one month; Richmond at $1,708,400, an increase of 0.6 per cent in one month; and North Vancouver at $1,723,200, an increase of 2.2 per cent in one month. On the lower side of the Benchmark are North Burnaby at $1,544,100, an increase of 0.7 per cent in one month; Vancouver East at $1,553,100, a decrease of 0.5 per cent in one month; and Port Moody at $1,484,800, an increase of 0.1 per cent in one month.

Townhouses

The Benchmark price for townhouses in the Greater Vancouver area at the end of March was $835,300, an increase of 2.0 per cent over one month. This average had extremities of $1,271,000 in Vancouver West, and increase of 1.7 per cent in one month; and $575,100 in Maple Ridge, an increase of 4.3 per cent in one month. Excluding Squamish and Whistler for their distance from Metro Vancouver, I have selected three municipalities closest on each side of the Benchmark. On the upper side are Vancouver East at $908,200, an increase of 4.5 per cent in one month; North Vancouver at $1,005,400, an increase of 0.7 per cent in one month; and Vancouver West at $1,271,000, an increase of 1.7 per cent in one month.
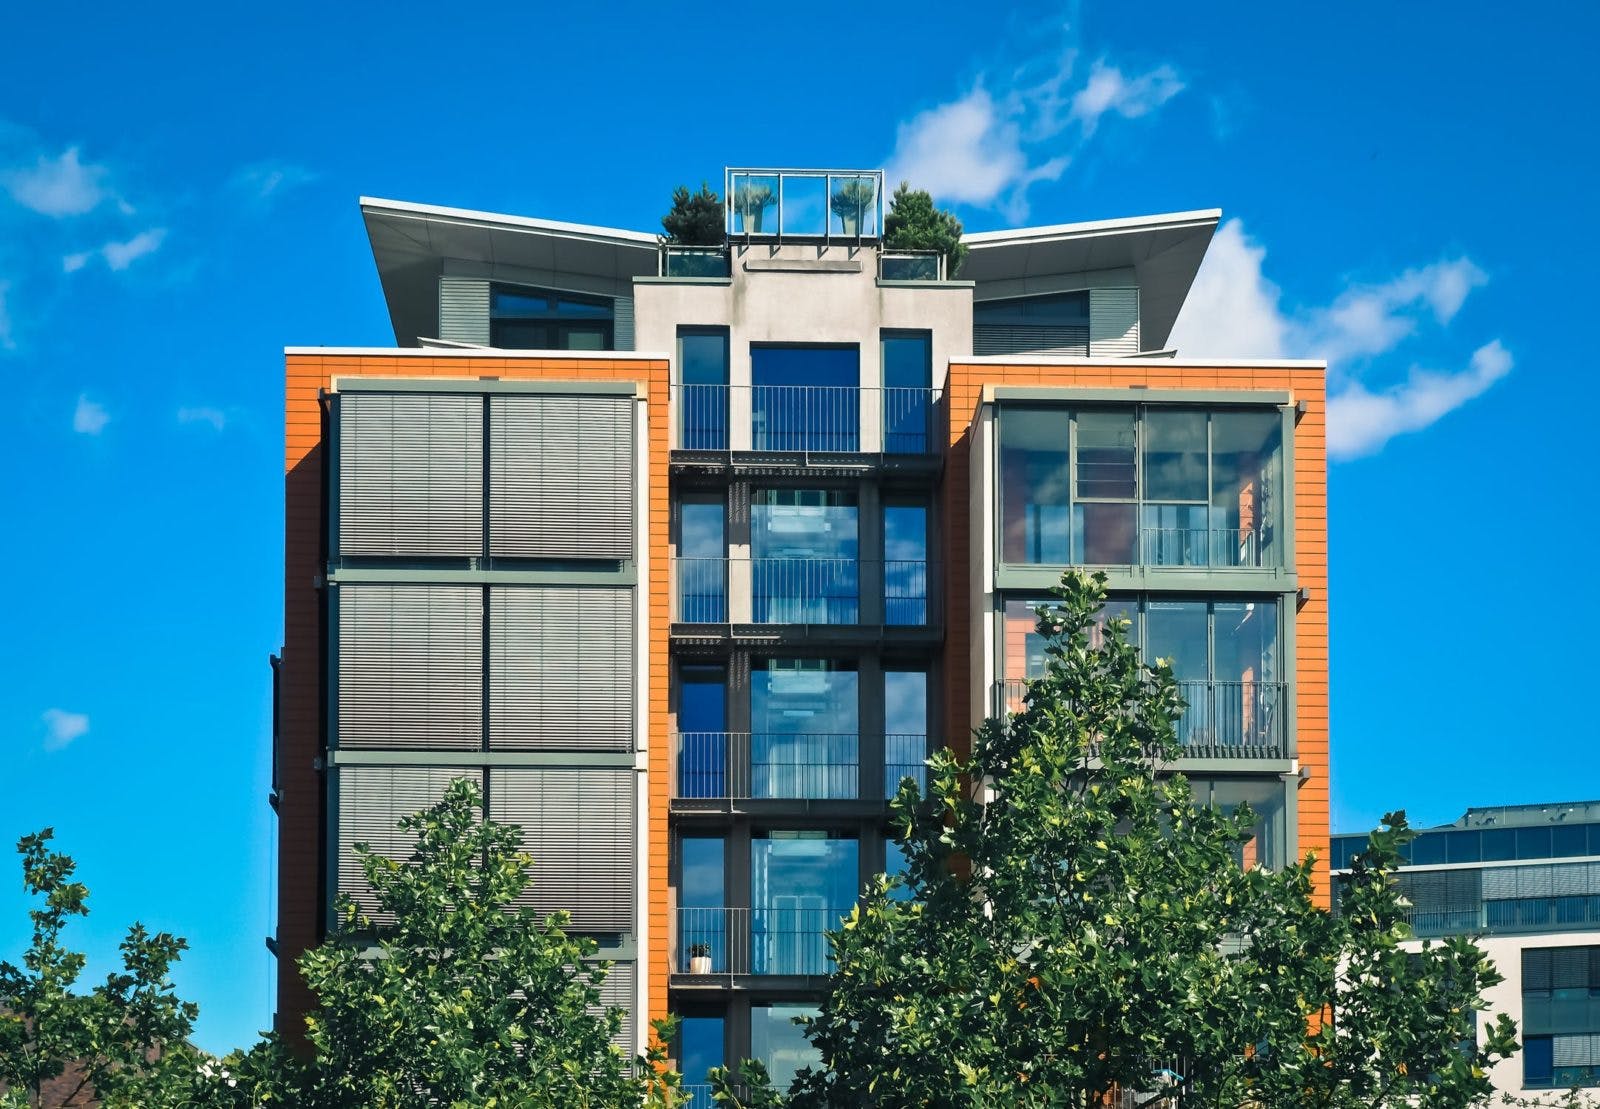
Condominiums

The Benchmark price for condominiums in the Greater Vancouver areas at the end of March was $693,500, an increase of 1.6 per cent in one month. The extremities for this average were West Vancouver at $1,278,600 and Ladner at $459,300. Again, excluding Squamish and Whistler because of their distance for Metro Vancouver buyers, here are three municipalities with closest prices on the upper and lower side of the Benchmark, along with their month over month price change: South Burnaby at $727,300, an increase of 2.4 per cent in one month; East Burnaby at $727,800, an increase of 3.0 per cent in one month; and Vancouver West at $844,700, an increase of 1.1 per cent in one month. Closest to the Benchmark on the lower side were Port Moody at $675,000, an increase of 1.0 per cent in month; Richmond at $659,700, an increase of 0.3 per cent in one month; and North Burnaby at $641,600, a decrease of 0.1 per cent in one month.

FRASER VALLEY

The Valley continues to be a very active market which shows no sign of slowing. With Spring around the corner, I urge anyone who is seriously contemplating a purchasing a Valley residence of any type to take advantage of open houses in their desired category. There were 2,865 new listings in March which was a close to a 25 per cent increase from February’s new listings. Keep in mind that new property listings in an active market can attract more prospective buyers, especially as the weather invites more viewers. Even with an increased inventory, demand is still very strong putting upward pressure on prices. At the end of last month there was a total inventory almost 5,000 properties overall. Townhouses and condominiums made up just over 50 per cent of all Valley sales and were the fastest to sell after their listing, on average 16 days for a townhouse and 13 days for a condominium. Single detached homes sold on average in 30 days after listing. Below I examine at each property type by their current Benchmark prices and make some recommendations on which municipalities you might wish to look.

Single Family Detached

A major milestone has been reached in the Fraser Valley. The million-dollar mark for a single detached residence was reached for the first time at the end of March with a Benchmark price $1,001,400, an increase of 0.9 per cent in one month. We have been waiting for several months to see this threshold reached. It now remains to be seen if this will be a psychological threshold as well, both for buyers and sellers. For the former, some prospective buyers may decide they are now priced out of a single detached home and begin to look for a home of another property type. For sellers, we will have to see if the new price level encourages more listings. Focusing on prices closest to this Benchmark average, along with their month-over-month price change, here is my standard selection of three areas above and below the Benchmark. On the upper side of the Benchmark were: Langley at $1.026,600, a decrease of 0.2 per cent in one month; Surrey at $1,031,500, an increase of 1.2 per cent in one month; and Cloverdale at $1,045,400, an increase of 0.8 per cent in one month. Closest on the lower side of the Benchmark price were: North Surrey at $980,100, an increase of 0.8 per cent in one month; North Delta at $950,200, an increase of 0.6 per cent in one month; and Abbotsford at $814,000, an increase of 1.3 per cent in one month.

Townhouses

The Benchmark price for a Fraser Valley townhouse at the end of March was $541,800, an increase of 2.0 per cent in one month. The extremities of this average were South Surrey/White Rock at $678,000 and Abbotsford at $383,000. Municipalities with prices closest to the Benchmark were: On the upper side, North Surrey at $573,800, an increase of 2.4 per cent in one month; Surrey at $577,800, an increase of 1.6 per cent in one month; and North Delta at $591,300, an increase of 1.8 per cent in one month; closest on the lower side of the Benchmark were: Langley at $514,900, an increase of 1.3 per cent in one month; Mission at $446,500, an increase of 3.0 per cent in one month; and Abbotsford at $383,000, an increase of 3.1 per cent in one month.

Condominiums

The Valley Benchmark at the end of March for condominiums was $440,400, an increase of or 4.3 per cent in one month. The extremities for this average were South Surrey/White Rock at $524,100 and Mission at $329,500. Municipalities with prices closest on the upper side of this Benchmark were: Langley at $444,500, an increase of 4.8 per cent in one month; Surrey at $452,300, an increase of 5.8 per cent in one month; and Cloverdale at $507,100, an increase of 3.9 per cent in one month. On the lower side of the Benchmark, the closest prices were in North Delta at $425,900, an increase of 8.1 per cent in one month; North Surrey, at $424,900, an increase of 3.5 per cent in one month; and Abbotsford at $336,600, an increase of 6.6 per cent in one month.

AFTERWORD

In closing, I suggest you pay close attention to any trends you may spot in the month-over-month increases in Benchmark prices that I mention in each newsletter. This may help you see where prices are driven by demand and as you become familiar with increases – or decreases – in the short term, this may assist your decision making. However, keep in mind that there may be other factors that cause price changes which is out of the usual range. If you have any questions and need specific information on any housing type in any of the areas in the lower mainland, please don’t hesitate to call me. I keep an close eye on the residential market, and I want to help my clients find what they are looking for, or to make a listing decision when the time is right.

Thanks for reading!

Sibo Zhang, REALTOR®

B.C.’s New Real Estate Taxes – Part 2

The Additional Property Transfer Tax

As mentioned in my last blog in March, one of two new real estate taxes announced by the B.C. government in its 2018 budget this past February is the Additional Property Transfer Tax. In this blog I will provide an outline of the measures covered by this tax and highlight some of the main points that could affect current B.C. property owners and prospective home buyers.

Prior to February 21, 2018, the property tax transfer rate was 15 % on properties in the Greater Vancouver Regional District. After February 21, the transfer tax increased from 15 % to 20 %, based on the fair market value at the time of registration for property transfers in the following areas in the province of British Columbia:

  • Greater Vancouver Regional District
  • Capital Regional District
  • Fraser Valley Regional District
  • Regional District of Central Okanagan
  • Regional District of Nanaimo

Two Important Exceptions

Excluding the Greater Vancouver Regional District, the remaining four regions noted above have two instances where you don’t have to pay the additional transfer tax on property transfers after February 21: First, you don’t have to pay if you register before, or on, May 18, 2018, as long as the property transfer is subject to a written agreement dated on or before February 20, 2018; and second, if the transfer is subject to a court order dated before February 20, 2018, or several other specific legal conditions on property transfers related to divorces, separations, or estates of deceased persons. I advise you to get advice from your lawyer if any of these situations applies to you.

As a general guide, the changes introduced on the property tax transfer took effect February 21, 2018. If you purchase a property that is registered at the provincial Land Title Office, you will need to pay certain transaction costs which are taxable. Without going into the details of the various legally required transactions – which your Realtor can explain to you – I want to point out to you that you can qualify for a reduced tax if you are: a) purchasing your first home; or b) purchasing a newly built home.

The tax is calculated on the fair market value at the time of property registration. Note that properties on the Tsawwassen First Nation lands are exempt from the additional property transfer tax. There are also two other exemptions which I would advise you get legal advice if you not sure they apply to you. The first is any exemption that applied to you for the previous property tax transfer also exempts you from the additional transfer tax, except in the following situations: i) a transfer resulting from an amalgamation; ii) a transfer to a surviving tenant; iii) a transfer where the transferee is or becomes a trustee in relation to the property, even if the trust does not change; and second, if you are confirmed B.C. Provincial Nominee and certain criteria are met for foreign nationals under the B.C. Provincial Nominee Program.

Foreign Nationals and Foreign Entities

If you are a confirmed under the B.C. Provincial Nominee Program when the property transfer is registered with the Land Title Office; ii) the property is to be used as your principal residence; iii) the property transfer is made to an individual. Note that the additional property transfer tax does NOT apply to registration of mutual fund trusts, real estate investment trusts or specified flow-through trusts. You should also note that if you were confirmed as a B.C. Provincial Nominee between August 2, 2016 and March 17, 2017, you might be eligible for a refund of the additional transfer tax if you paid it.

If you happen to be a foreign national, a foreign corporation, or a taxable trustee, there is also an additional transfer tax on residential properties in certain areas of British Columbia, as listed above.

This summary of the new Additional Property Tax is based on information provided by the Government of British Columbia. I have summarized what I think are the major points of interests for my clients; however, like any tax measures, there are always situations that may require more in depth information. I would recommend that if you think you may be in such a situation that you talk to a knowledgeable tax lawyer about your specific situation. I hope the above summary has informed you adequately to understand if the new transfer tax may apply to you, You may find additional information on the new transfer tax at: B.C. Provincial Budget Tax Changes.

I will watch for any changes in these tax rules and report what I see in the blog space. Please feel free to ask for any advice that I might be able to provide. I’m always happy to help in any way I can.

Thanks for reading!

Sibo Zhang, REALTOR®

B.C.’s New Real Estate Taxes (Part 1)

You have probably heard about two new taxes related to real estate transactions in the province of British Columbia. In order to give you a general understanding and to highlight some key issues that may affect prospective home buyers, I will devote this blog and my next one to these new taxes announced in the B.C. provincial budget this past February. In this blog I focus on the new Speculation Tax. In my next blog in early April, I will discuss the province’s Additional Property Tax Transfer.

New Speculation Tax

The British Columbia government announced in its 2018 Budget in February that it would introduce what is called a Speculation Tax which will affect some home owners and prospective home buyers. At this time, the government has not released all the details of this new tax, but in the blog I will outline the general features of the proposed legislation as there are many questions owing to a lot media attention on the topic.

The first thing I want to draw to the attention of my readers is that the majority of homeowners in B.C. will be exempt from the tax, which will apply initially in Metro Vancouver, the Fraser Valley, the Capital Regional District, the Nanaimo Regional District, and in the municipalities of Kelowna and West Kelowna. Home owners will receive first tax notice in the fall of 2018.

The government has said it will be effective for the 2018 tax year, and that it will target foreign and domestic persons who are speculating with their purchases of residential properties in the province. The tax rate for 2018 will be $5.00 per $1,000 of the assessed property value. In 2019, the rate will increase to $20.00 per $1,000 of assessed value. The government’s early information on what this means is not highly detailed yet, but its intent seems quite clear. Speculators will be considered as home owners who are primarily interested in the rising value their property may acquire during a time that it is not occupied by the owner, or a least occupied very little of the time, and is not a long-term rental property. Long-term rental properties will be exempt from the tax, but short-term rentals by out of province owners will be taxed.

Without digressing from the basic facts of the new tax, I think it’s safe to assume that this tax measure is an attempt to keep speculators from driving up housing prices by buyers who wish to invest in a residence to make money primarily from its rising value and not as place to live as a principal residence. In fact, the government’s preliminary information describes some of these owners as “Satellite families – households with high worldwide income that pay little income tax in B.C.”

Tax Credit for B.C. Residents Affected by the New Tax

For B.C. residents who may be caught by the tax because they vacate their home for extended vacations, or who may wish to rent the property on a short-term basis, the provincial government is going to implement a corresponding income tax credit to help offset the tax for B.C. residents. More information on this income tax credit has been promised by the government before the tax is implemented, but it has announced that Satellite families will not be eligible for a principal residence exemption, although they will still be eligible to claim the income tax credit – to the extent that they pay tax in British Columbia.

In cases where a B.C. resident who own two homes, for example a principal resident in Vancouver and a vacation property in Kelowna, they would be able to apply for the B.C. income tax credit. In other words, the vacation property will be subject to the new tax, but the owner will be able to claim an income tax credit in such a case. The B.C. government has said that among its goals for the new tax will be to minimize the administrative compliance burden for the vast majority of home owners who will be claiming the up-front exemption. The objective is to reduce the number of notices that will need to be sent in future years.

Obviously, there are many questions that need to be answered at this time. B.C. property owners that may be subject to the tax will want to know the definitions of key terms such as short-term and long-term rentals, and other specifics of the new speculation tax. I will endeavor to provide additional information for my readers when it is available. The B.C. government has said it will issue notices by mail to advise residential property owners to a B.C. Government website that will have an electronic tax form or phone numbers with more information. Until then, you may find some information at www.gov.bc.ca/propertytaxes

Thanks for reading!

Sibo Zhang, REALTOR®

Your March Market Update for Metro Vancouver and the Fraser Valley

If you happened to read the news story in the Globe and Mail at the beginning of the month, the headline surely intrigued you: “Vancouver housing sales fall 9 % in February.” The story behind the decline is really the more important consideration for prospective home buyers. As a statistician, I always want my clients to understand the reason when a number is cited.

First, the February sales decline is for all property types across Metro Vancouver, so we will have to look more closely at the different categories. Based on ten-year sales average, February’s sales for all property types were down 14.4 per cent; detached sales declined 39.4 per cent; townhouse declined 6.8 per cent, but condominium sales rose 5.5 per cent above the 10-year average. Second, the 9 per cent decrease is a comparison with February sales in 2017. It’s a significant percentage, but the actual number of sales for the respective months were 2,207 in 2018 and 2,424 in 2017, so in practical terms not really a huge difference. And the number of sales in February this year was a monthly increase of 21.4 per cent over January, so it’s important to recognize that the market is still very active. The composite benchmark price for all residential properties in Metro Vancouver at the end of February was $1,071.800, a 16.9 per cent increase year-over-year and a 1.4 per cent increase since January this year. It will be important to watch these two price levels in coming months.

What the newspaper story was really about what may be the beginning of fewer sales each month following the provincial budget announcements in February that impact out-of-province buyers. The BC government has targeted speculative buyers with an additional tax as well as increasing and expanding the foreign buyers tax beyond Metro Vancouver. I will talk more about these tax measures in my next Blog, but for now I will focus on the market place prices for prospective local home buyers and sellers.

Detached Properties

The benchmark price for a single detached property in Greater Vancouver at the end of February was $1,602,000, an 8.2 per cent increase from the February 2017, and a 1.9 per cent increase from January this year. The extremities of this average range from a high in Vancouver West (higher than West Vancouver, and excluding Whistler) at $3,500,600 to a low in low in Maple Ridge at $847,700. That’s obviously quite a large spread, so I’ve selected three areas on each side of the Benchmark where you can find properties closest to the Metro Benchmark at the end of February. On the higher side, the Burnaby South Benchmark price was $1,682,600, an increase of 0.9 per cent over the previous month. North Vancouver’s Benchmark was $1686,800, an increase of 1.0 per cent over the previous month; and Richmond’s Benchmark was $1,697,900, an increase of 0.4 per cent over the previous month. On the lower side, the Vancouver East Benchmark was $1,560,400, a decrease of 0,2 per cent from the previous month; the Burnaby North Benchmark was $1,532,700, a decrease of 2.2 per cent from the previous month; and Port Moody’s Benchmark was $1,483,700, a decrease of 0.7 per cent from the preceding month.

Townhouses

The Benchmark price for a townhouse in Metro Vancouver at the end of February was $819,200. This average was made up of prices ranging from a high of $1,250,100 in Vancouver West to a low of $551,400 in Maple Ridge. I have again selected three areas on each side of the Benchmark which are closest to the Benchmark at the end of February. On the higher side, almost identical to the Metro Benchmark was the Richmond Benchmark at $819,500, a decrease of 0.4 per cent from the previous month. The Benchmark for Vancouver East was $868,900, an increase of 1.3 per cent from the previous month; and the North Vancouver Benchmark at $998,400, an increase of 0.7 per cent from the previous month. On the lower side, the Benchmark for Burnaby South was $807,600, an increase of 2.7 per cent over the previous month. The Tsawwassen Benchmark was $756,000, a decrease of 0.9 per cent from the previous month; and the Ladner Benchmark at $783,200, an increase of 0.9 per cent from the previous month. In this breakdown, I have excluded Whistler as I normally do for areas farther out than my clients wish to look.

Condominiums

The Metro Vancouver Benchmark price for condominiums at the end of February was $682,800. The extremities of this average ranged from a high in West Vancouver at $1,237,100 to a low in Maple Ridge of $307,800. Here is my selection of three areas closest on both sides of the Benchmark. On the higher side, the Benchmark for Burnaby East was $706,700, an increase of 2.6 per cent over the previous month. The Benchmark for Burnaby South was $710,100, an increase of 1.8 per cent over the preceding month; and Vancouver West’s Benchmark at $835,800 was an increase of 2.9 per cent over the previous month. On the lower side, the Benchmark for Port Moody was $668,300, an increase of 4.0 per cent over the previous month. Richmond’s Benchmark at $657,800 was an increase of 1.2 per cent over the previous month; and the Burnaby North Benchmark at $642,500 was an increase of 3.9 per cent over the previous month. These selections are made to guide my clients who are looking to purchase, or sell, one of these property types within the Metro Vancouver region based on the mid-range prices of comparable properties.

There are of course many properties in areas outside the mid-price range I have focused on in my selections above. If you would like to learn more about prices in any other areas of Greater Vancouver, I will be happy to help you find a property that fits your mortgage range. Please feel free to give me a call.

FRASER VALLEY

There was also a decrease – a small one — in the year-over-year number of February sales in the Fraser Valley, a mere 0.8 per cent decline. However, the Valley continues as a high demand area, noted by February’s 14.5 per cent increase over January 2018 sales activity. As has been the case for many months, attached properties – townhouses and condominiums – together represented more than half of all the transactions. Fraser Valley home seekers can again be buoyed with the fact that inventory in February increased 9.5 per cent over the preceding month, bringing the total supply of properties on the market at the end of February to 4,340.

For anyone thinking about listing their property for sale, it is nonetheless a good time because demand continues to be greater than the 10-year average for this time of year. During the month of February, detached properties took on an average of 38 days to sell, while townhouses sold after an average of 28 days, and condominiums on an average of 13 days. I highly recommend home purchases in the Fraser Valley at this time. Prices on average are still below those of comparable properties in Metro Vancouver. The composite Benchmark price for all property types in the Fraser Valley at the end of February was $795,100. For this reason, it is a favorite starting area for young families and singles often looking in the townhouse and condominium market segment. However, there is excellent value to be found in all housing types, and for families who want to start with a detached property, or perhaps move up to detached home from their existing townhouse, the Valley has very good prices. I will review the Benchmark prices for each property type in the space below and will make some recommendations on which areas you might wish to look for your preferred price range.

Detached Homes

The Benchmark price for a single family detached home in the Fraser Valley was $992,100 at the end of February, an increase of 1.0 per cent over the preceding month, and a 15.7 per cent increase year-over-year. Compared with the Metro Vancouver Benchmark of $1,602,000 for a comparable property, you can see why this is an attractive investment. The extremities of this average are not as far apart as Metro Vancouver areas, with South Surrey/White Rock at the high end at $1,482,800 and Mission at the low end at $663,500. Closest to the Valley Benchmark on the higher side at the end of February were: Cloverdale at $1,036,600, a 2.2 per cent increase over January; Langley at $1,028,200, a 0,4 per cent increase over January; and Surrey at $1,019,500, an increase of 0.6 per cent over January. Closest to the Valley Benchmark on the lower side were: North Surrey at $972,100, an increase of 0.6 per cent over January; North Delta at $944,800, an increase of 0.4 per cent over January; and Abbotsford at $803,300, an increase of 2.2 per cent over January.

Townhouses

The Benchmark price for townhouses in the Fraser Valley was $531,000 at the end of February. This average is from the extremities of $656,000 in South Surrey/White Rock and $371,600 in Abbotsford. Closest on the higher side of the Benchmark were: North Surrey at $560,200, an increase of 3.1 per cent over January; Surrey at $569,000, an increase of 2.1 per cent over January; and North Delta at $581,000, an increase of 0.4 per cent over January. Closest to the Benchmark on the lower side were: Langley at $508,500, an increase of 1.9 per cent over January; Abbotsford at $371,600 and increase of 2.7 per cent over January; and Mission at $433,400, an increase of 0.3 per cent over January.

Condominiums

The Benchmark price for condominiums in the Fraser Valley was $422,300 at the end of February. The extremities for this average were $519,00 in South Surrey White Rock and $315,400 in Mission. Closest to this Benchmark on the higher side were: Langley at $424,300, an increase of 4.3 per cent over January; Surrey at $427,400, an increase of 6.3 per cent over January; and Cloverdale at $488,100, an increase of 4.0 per cent over January. Closest on the lower side of the Benchmark price were: North Surrey at $410,400, an increase of 4.8 per cent over January; North Delta at $394,100, an increase of 4.8 per cent over January; and Abbotsford at $315,900, an increase of 5.3 per cent over January.

I selected the above areas to assist you in your search for a home to fit your mortgage capability. Keep in mind that the Benchmark prices are a comparison of comparable properties in their respective categories.

If there is any area that you would like to get more specific information on prices in any area, please feel free to call me. I keep a close eye on new listings and changes in prices, and I am always happy to help in any way I can.

Thanks for reading!

Sibo Zhang, REALTOR®


Your February Real Estate Recap for Metro Vancouver and the Fraser Valley

METRO VANCOUVER

As we move into the second month of 2018, average price levels across all property types continue to inch upwards, or remain the same as last month. However, it’s worth keeping in mind that even a modest price increase of less than 1.0 per cent can add several thousands of dollars to home when we are in a market where the composite benchmark price for all residential properties, based on last month’s closing figures of the Real Estate Board of Greater Vancouver, is $1,056,500. Since my January newsletter, when this same benchmark was $1,050,000, you can see the actual difference. So, once again, my general advice to anyone who needs to find a home before being outpriced, is not to delay because it’s likely you will pay more in the future for a similar property. That said, I am still continually scouring the market for any specific good buys for my clients that can get overlooked in a general average.

Some good news this month is that there were 3,796 new listings across all property types on the Multiple Listing Service for Metro Vancouver. This brings the total inventory of listed properties to 6,947, which provides a wide choice selection, although admittedly in a high demand market. Looking at the sales in each property type last month, we continue to see the greatest number was for condominiums with 57.2 percent, followed by townhouses with 32.8 per cent. Detached homes remained in the last place, as has been the trend for several months. Looking at the actual number of sales in each category last month, we can compare these figures with one year ago to see the underlying upward pressure on price levels now in place. Detached home sales in last month were 487, an increase of almost 10 per cent over January sales in 2017. The current benchmark price for detached properties in Metro Vancouver is $1,601,500, an increase of just over 8 per cent since January 2017. Condominium sales last month were 1,012, an increase of almost 23 per cent since January 2017. The current benchmark price for a condominium in Metro Vancouver is $665,400, an increase of slightly more than 27 per cent over January 2017. Townhouse sales last month were 319, almost 26 per cent higher than sales in January 2017. The benchmark price for a Metro Vancouver townhouse is currently $803,700, an increase of almost 18 per cent since January 2017. Although the correlation between the increase in sales and the increase in price here is a bit rough, there appears to be relationship between the monthly number of sales and the price increases that is somewhat in synch. You might want to use this a rule of thumb, though not a perfect one, for predicting future price increases in whatever property category you are searching. I will keep you informed of monthly sales and prices in each of my newsletters.

Detached Properties

There is quite a large difference between the extremes in prices for Single Family Detached homes across Metro Vancouver. Excluding areas such as Whistler and Sunshine Coast which are farther out than my clients are looking, here is the range of the prices that make up the benchmark price of $1,601,500. In West Vancouver and Vancouver West, the benchmark price is, respectively, $3,099,500, and $3,548,400. On the other end of the scale are Maple Ridge and Pitt Meadows, at, respectively, $833,600 and $904,600. Only Burnaby South, Richmond and North Vancouver are higher than the Metro Vancouver benchmark, while other municipalities are currently below. In each of the middle-priced municipalities, the prices are close to the Metro Benchmark. I will be happy to supply anyone looking to buy a detached property an exact benchmark for the desired area if you would like to contact me.

For the other property types, I have made the following area selections based on current price changes.

Townhouses

The benchmark price for townhouses in Metro Vancouver, excluding Whistler and Squamish, remained unchanged since the previous month’s figures at $665,400. The extremities of the average in January ranged from $1,247,900 in Vancouver West to $533,800 in Maple Ridge. Two municipalities showed a one month decrease: Vancouver East with a benchmark of $857,600 was a drop of 2.5 per cent from one month previous, and Ladner at $776,000 was a one month decrease of 0.1 per cent. Most of the other municipalities had small increases below 1.0 per cent. But there were three notable exceptions where the month-over-month benchmark price was somewhat higher: Burnaby South showed the biggest jump with a 2.8 per cent increase to $786,400; Richmond had one month increase of 1.8 per cent to $822,500; and Burnaby East increased 1.3 per cent to $667,900.

Condominiums

The benchmark price for condominiums in Metro Vancouver, excluding Whistler and Squamish, showed a 1.5 per cent increase over one month. The benchmark average had extremities of $1,179,400 in West Vancouver, which was a one month increase of 0.7 per cent; and $291,500 in Maple Ridge, a one month increase of 3.3 per cent. Notably, the one month increase in Maple Ridge was the highest across Metro Vancouver, followed by a 3.2 per cent increase in Pitt Meadows to $436,200. The third highest monthly increase was in Burnaby North at $618,400. It is worth observing that the largest monthly increases appear to be happening in the lower priced market segment. Since condominiums are often the entry level for residential property owners, I would recommend that this category of buyers, often singles or young couples, not delay in making a purchasing decision if your budget down payment and mortgage are already determined.

FRASER VALLEY

The Valley market showed one of the strongest January sales volumes ever, with 1,210 sales across all property types. This was a 24 per cent increase for January sales since 2017, and third highest January on record with the Fraser Valley Real Estate Board. The January benchmark price for a Fraser Valley Single Detached property $982,700, still under the $1-million mark and only a slight increase 0.6 per cent from the preceding month. Note that this was a over a 15 per cent increase year over year, which is a good reflection of the market activity in this region. The greatest sales activity, however, continues to be for townhouses and condominiums, which represented 51 per cent of all sales in January. Of the total number 1,210 of residential sales, 281 were townhouses, and 338 were condominiums. It is important to note that demand is outpacing supply in the Fraser Valley. While there were 2,092 new listings in January, which brought the total Valley inventory to 3,962, there continues to be an increasing number of potential buyers, so prices overall are moving upwards, although not with any alarming increases. I will be happy to show provide specific and current benchmark prices for single detached properties to anyone shopping in the that category, but with most Fraser Valley clients looking for the other two property types I will focus on these segments here.

Townhouses

The January benchmark price for a Valley townhouse was $519,400, a 1.2 per cent increase from the preceding month. Again, I point out that this price level is a year over increase of 23.4 per cent so it is important keep in mind that delayed purchasing decisions in this current market can be costly. The current benchmark average price has relatively narrow extremities ranging from a high in South Surrey/White Rock at $664,200 to a low of $361,800 in Abbotsford. Interestingly, the South Surrey/White Rock price is a 0.5 per cent decrease from the preceding month. All other municipalities show modest month-over-month increases. The areas with the three largest month-over-month benchmark price percentage increases were: Mission at $432,000, an increase of 3.7 per cent; Langley and North Surrey both had monthly increases of 1.9 per cent, bringing their prices, respectively, to $499,200 and $543,400; and Abbotsford, at $361,800, a monthly increase of 1.7 per cent.

Condominiums

The January benchmark price for a condominium in the Fraser Valley was $404,100, a month-over-month increase of 4.0 per cent. The extremities of this average range from $507,400 in South Surrey/White Rock, an increase of 4.0 per cent from the preceding month to $300,100 in Abbotsford, an increase of 4.7 per cent from the preceding month. The three municipalities with the biggest month-over-month increase in this segment’s benchmark price were Surrey, with an increase of 5.2 per cent bringing its January benchmark to 402,000; Abbotsford, with an increase of 4.7 per cent bringing its January benchmark to $300,100; and Cloverdale, with an increase of 4.6 per cent, for a January benchmark of $469,300. Again, I would draw attention to larger percentage increases often occurring in the lower end of the market prices. For entry level buyers, I would advise if you are looking for condominium to get started, that you don’t delay too long as prices are moving up in this market segment.

If any of my newsletter readers would like a personal and confidential consultation on your home requirements, I would be very happy to advise you. I have experience in both finance and Real Estate, and pay close attention to the market.

Please feel free to give me a call. I am here to help!

Thanks for reading!

Sibo Zhang, REALTOR®

Your January Real Estate Recap for Metro Vancouver and the Fraser Valley

A New Year and New Considerations

As we launch into a new year of residential sales across B.C.s Lower Mainland, there are developing issues that prospective home buyers and sellers will want to track, such as how increased mortgage rates and how new government regulations on qualifying for a mortgage may affect the market. I want to help my readers keep abreast of these developments and to make sense of the real estate market dynamics, so I invite you to check this newsletter each month for the latest updates.

In this my first newsletter of 2018, I will start with an overview of the how the residential market place looks compared with last year. This will give you a baseline for watching trends over the coming year, and hopefully will help your plans for either a selling or buying transaction, or simply being an interested observer of one of Canada’s most active real estate market places. I will start first with Metro Vancouver, with the most recent figures from the Real Estate Board of Greater Vancouver

METRO VANCOUVER

Overall, residential prices in the Greater Vancouver area (Metro Vancouver) rose substantially during 2017. The composite Benchmark price for all residential properties in Metro Vancouver at the end of last year was $1,050.300. That was almost 16 per cent higher than one year earlier. Breaking down the year-over-year increase to different property types, detached properties rose 7.9 per cent; townhouses rose 18.5 per cent; and condominiums rose 25.9 per cent. The higher relative price increases reflect greater sales activity in the latter two categories.

Detached properties

As was the case for much of last year, detached properties did not show large month-to-month price increases. In that category it still appears to be waiting game. Owners of detached homes are not rushing to list their properties at a Benchmark price of $1,605,800. If it is price that determines when to list a property for sale (remember the maxim: ‘everything has its price’), this suggests owners see more residual value in their detached properties than the current price level would fetch. There was actually a decrease of 54 per cent in detached listings from November to December 2017. So, if you want to consider the purchase of a detached home at this time, I believe it would be an excellent investment even at Benchmark price over $1.5-million. You should also keep in mind that new government regulations on mortgage qualifications (see my blog post for December 2017, Your December Real Estate Recap), as well as the prospect of higher interest rates coming later this year, will likely shrink the number of buyers for higher priced properties in the detached property category. For home seekers with a lower price in mind, I would recommend looking in townhouse or condominium market where there are some very good opportunities with Benchmark prices for properties in Metro Vancouver still under $1-million.

Townhouses and Condominiums

The Benchmark price for townhouses in Metro Vancouver at the beginning of 2018 was $803,700 and for condominiums $655,400. For townhouses, this was a slight decrease of 0.2 per cent from the previous month, while for condos it was an increase of 1.1 per cent. In last month’s newsletter I said I would watch a possible widening in the difference between townhouse and condo prices based on monthly increases and decreases. The current differential is a total of a 1.3 per cent compared to last month’s 0.7 per cent, so it is continuing to look as if a widening gap is beginning. It is too early to be certain at this time, but I’ll continue to track this metric so you can check next month to see how it is developing. Below is a breakdown of my suggested areas to look for these two property types based on Benchmark prices at the end of December 2017. This month I have selected three areas with the greatest month-over-month increase and three with the biggest declines, but each with prices still under $1-million.

For townhouses, the greatest increases in Benchmark prices were in East Vancouver at $879,200, a 2.0 per cent increase over one month; Ladner at $776,900, a 2.7 per cent increase over one month; and North Burnaby at $728,200, a 2.3 per cent increase over one month. The biggest decreases from the preceding month (excluding the outlying areas of Whistler and Squamish) were in North Vancouver at $982,800, a decrease of 0.1 per cent over one month; Port Coquitlam at $632,700, a decrease of 0.5 per cent over one month; and Maple Ridge at $527,500, a decrease of 1.0 per cent over one month.

For condominiums, the greatest increase in Benchmark prices were in Richmond at $637,200 an increase over one month of 4.0 per cent; Pitt Meadows at $422,800, an increase over month of 2.1 per cent; and Burnaby East at $681,400, an increase over one month of 1.9 per cent. Two others also had month-over-month increases of 1.9 per cent: New Westminster at $503,300 and Coquitlam at $502,900. Three areas had one month decreases: North Vancouver at $560,600, down 1.0 per cent; Tsawassen at $462,400, down 1.1 per cent; and Vancouver West at $807,100, down 0.5 per cent.

FRASER VALLEY

The Benchmark price for a detached property in the Fraser Valley at the end of last year was $976,400, a slight increase from the preceding month but still under the $1-million bracket in Metro Vancouver. However, as was the case throughout the year, townhouse and condominium sales dominated residential sales in the Valley at the end of 2017. These two property types made up more than half of all Valley sales 2017, with 5,198 townhouses and 6,183 condominiums.

The Fraser Valley continues to be the area of choice for many first-time home buyers in 2018, both for young families and individuals starting out in their careers. It offers very attractive properties in comfortable and enjoyable neighborhoods with excellent lifestyle options for both families and singles. Public transportation planning across the region makes any of the municipalities an excellent investment option for the long term. And with prices still significantly below those in Metro Vancouver, the Fraser Valley continues as one of the hottest residential markets. In the month December 2017, there were a total of 1,344 sales, the second highest December volume ever. Nonetheless, there were 1,277 new listings during the month, and the inventory for December 2017 ended with 3,818 active listings, so I encourage anyone looking for Valley home to shop seriously at this time. Below I make my monthly recommendations for the areas to search for excellent value. For each property type this first month of January, 2018, I have chosen to compare the year-over-year increase along with the last month increase or decrease. In some municipalities the Benchmark price has crept above the $1-million mark for the first time. Many clients in this market segment want to consider their investment compared to Metro Vancouver, so I have therefore selected four municipalities where the detached Benchmark price is over $1-million. For townhouses and condos, I have selected areas with the biggest increase from one year earlier.

Detached Homes

At the end of 2017, the December Benchmark price in Surrey/White Rock was $1,472,300, an increase of 4.8 per cent from one year earlier, and an increase of 0.2 per cent from the preceding month. The Benchmark price for a detached property in Surrey Central was $1,014,900, an increase of 17.1 per cent from one year earlier, and an increase from one month earlier was 0.2 per cent. In Cloverdale, the December Benchmark price was $1,004,900, an increase of 17.2 per cent from one year earlier, and an increase of 0.7 per cent from the preceding month. In Langley the December Benchmark price was $1,002,200, an increase of 15.8 per cent from one year earlier, and a decrease of 0.5 per cent from the preceding month.

Townhouses

The biggest year-over-year increase in townhouse Benchmark prices at the end of December 2017 was in North Surrey with a Benchmark price of $414,200, an increase of 28.8 per cent from the end of 2016, and a 1.8 per cent increase over the preceding month. The Benchmark price in Surrey Central was $549,700, an increase of 27.2 per cent from the end of 2016, and an increase of 1.6 per cent from the preceding month. In Cloverdale, the Benchmark price was $572,600, an increase of 26.9 per cent and a 0.9 per cent increase from the preceding month.

Condominiums

North Delta saw the biggest year-over-year increase in the Benchmark price for condominiums. There the Benchmark price at the end of 2017 was $361,800, an increase of 44.1 per cent since the end of 2016, and a 3.9 per cent increase over the preceding month. The Benchmark price in Langley was $396,900, and increase of 40.3 per cent over one year, and an increase of 2.0 per cent from the preceding month. In Abbotsford, the Benchmark price was $286,600, an increase of 33.6 per cent over one year, and a increase of 2.5 per cent from the preceding month.

I hope you fill find these suggestions helpful, and I wish you great success in your home search or sale as we begin this new year. I am always eager to help my clients in any way I can. Remember, I keep a close watch on market changes, so please feel free to call me any time you have a question.

Thanks for reading!

Sibo Zhang, REALTOR®

Your December Real Estate Recap

With Christmas almost here, I know it’s a bustling time that can also be somewhat stressful even as we enjoy festive activities, often in the homes of our friends and relatives. For my clients who are currently in the market to buy a home, this can also be a good season to refresh your spirits from your hard work, and look forward to next Christmas when you are entertaining guests in your new home. It’s a happy season when we can really appreciate the value of home ownership – something that enhances our enjoyment of life and gives us a sense of stability with a longer-term focus for our daily routines.

The Metro Vancouver housing market has given us a gift this season as well. There were over 4,000 newly listed residential properties in the month of November. On top of that, the composite benchmark price for all properties increased a mere 0.4 per cent from October, so there is good reason to actively pursue the home you want at this time. It’s probably wise to think that the modest monthly price increases that have been occurring over recent months will not continue forever. Keep in mind that this past November’s composite benchmark price was 14 per cent higher than one year ago. We don’t have a crystal ball to tell us when the next major surge in demand may suddenly drive prices much higher, but we can be reasonably certain that Vancouver will continue to attract more home buyers, even at the higher end for a single family detached home which is currently at a benchmark in Metro Vancouver of $1,608.000. Prices above the $1-million psychological threshold that I have talked about for several months will eventually begin to move higher more quickly.

For other property types, the November benchmark price for Metro Vancouver townhouses was $805,200; and for condominiums, $648,200. As with detached properties, a similar modest monthly price increase occurred with a 0.3 per cent increase for townhouses, but for condominiums it was a full 1.0 per cent higher than October. I will monitor this differential in the coming months because I see a possible rate of change widening between townhouses and condominiums. Consider that the six-month differences were increases of 8.7 per cent for townhouses and 11.0 per cent for condominiums; and the twelve-month difference was an increase of 17.9 per cent for townhouses and 23.9 per cent for condominiums. There appears to an upward sloping curve developing faster for price increases of condos, which I will keep you informed about in future newsletters. Below is a breakdown of my suggested areas to look for these two property types based on November’s figures.

For townhouses, there are six areas that showed an increased price of less than 0.1 per cent from October. With their respective Benchmark prices in November, these were: Vancouver West at $1,268,200, an increase of 0.3 per cent; North Vancouver at $983,600, an increase of 0.7 per cent; Vancouver East at $861,900, an increase of 0.8 per cent; Richmond at $805,500, an increase of 0.7 per cent; New Westminster at $682,300, an increase of 0.5 per cent; and Maple Ridge at $532,900, and increase of 0.6 per cent.

For condominiums, there are four areas that showed an increased price of less than 0.1 per cent from October. With their respective Benchmark prices in November, these were: Vancouver West at $811,200, an increase of 0.6 per cent; Richmond at $612,900, an increase of 0.5 per cent; Vancouver East at $540,300, an increase of 0.3 per cent; and New Westminster at $493,900, an increase of 0.6 per cent.

Fraser Valley

The Valley remains a popular area for young families and singles buying their first home. The benchmark price for a Single Family Detached home is still under the $1-million mark despite months of speculation that it would surpass this threshold very soon. The November price of $972,700 was only 0.1 per cent higher than October, so like Metro Vancouver, the monthly rate of increase is still low and generally stable at present. The rate of increase for the same property type from one year ago was 13.5 per cent. It’s probably safe to assume that this rate of increase will continue similarly, or even accelerate over the next year. Even continuing at the same rate, it would mean in one year the benchmark price will be over the $1-million mark. For this reason, anyone looking to buy a Single Family Detached Property in the Valley might want to make that purchase soon. One area that is very close to reaching the $1-million benchmark price are Cloverdale at $998,100, followed by two others: North Surrey at $941,800 and North Delta at $914,900. I would be happy to show you some homes that would be good investments in any of these areas.

The greatest sales activity in the Fraser Valley continues to be in attached homes, with 425 townhouses and 426 condominiums sold in November. The market is still “hot” so I encourage anyone who is really wanting to buy in the region to make an offer without delaying. The average length of time to sell a townhouse last month was 21 days, and 17 days for a condominium. These two property types provide some affordable prices, especially for young singles who are getting into the condominium market for the first time, or young couples who are looking for larger townhouse to start raising a family. The November benchmark price for Valley townhouse was $505,700, and for a condominium $376,700. You can see at these prices why the Valley is so popular. Below, I have selected some areas where I think there are some excellent choices for buyers who are watching current prices.

For townhouses, this month I want to draw your attention to the areas of North Delta, and South Surrey/White Rock. Both these areas have seen an interesting benchmark price change from October to November. They are the only two Fraser Valley areas where the townhouse benchmark has actually decreased. A decrease in price is unusual when so many people are looking to buy, but it does not necessarily mean that the value of the property has decreased. Decreases can occur in short term periods depending on variety of reasons, ranging from the supply-demand ratio to a specific seller’s personal circumstances and desire to sell. In North Delta, the November benchmark price for a townhouse was $564,100, a 2.5 per cent decrease from October. In South Surrey/White Rock, the benchmark price was $642,600, a 0.8 per cent decrease from October. For condominiums, I suggest my clients would find a very nice unit in a price range similar to the Valley benchmark price in the following areas: Here I have also included the one month rate of change since October. There were no decreases for this property type. Starting as far out as Langley, the benchmark price was $389,900, a 2.6 per cent increase; Surrey was at $371,900, a 2.1 per cent increase; North Surrey at $362,000, a 2.0 per cent increase; and North Delta at $328,100, a 0.9 per cent increase.

I am always keeping my eye on market trends, so please give me a call if you have any questions at all about home prices, or what is available for your specific needs. I love to work with numbers, and people, and I am happy to look at your specific requirements to help you with the purchase or sale of your home.

Thanks for reading!

Sibo Zhang, REALTOR®

New Mortgage Stress Test Rules Starting in 2018

Canadian home buyers will face a new federal government regulation effective January 1, 2018. In the New Year ahead, all home buyers will have a new “stress test” when they apply for a mortgage with their bank or credit union. Until now, the test applied only to those borrowers who did not take out mortgage insurance – typically, borrowers with at least a 20 per cent down payment on their total mortgage were not required to take mortgage insurance. Under the new rules, all borrowers, whether insured or uninsured, will be required to meet the test criteria designed to evaluate a borrower’s likelihood to be able to make payments under possible future conditions.

You may recall in July this year, the Bank of Canada announced an increase on mortgages of 0.25 per cent. At that time, I wrote about why the central bank was raising the prime rate – a move to “cool” rapidly escalating housing prices, and what it would mean for prospective home buyers. When the rate increase was announced, it was proposed as the first of successive increases at later dates. I know many people decided then it was time to purchase a residential property before the next rate increase. The new stress test rule suggests that further rates increases could be on the way.

The stress test will be made on the basis of your financial institution’s posted five-year average mortgage rate, or on a rate that is two per cent higher than its actual mortgage rate – whichever one is higher. Basically, the new rule is to protect against a possible payment default by the home purchaser if interest rates go up beyond their ability to pay. It should be noted, however, that borrowers who already have a mortgage will be exempt from the new rule as long as they renew their existing mortgage at the same financial institution.

The federal government, through the Office of the Superintendent of Financial Institutions (OSFI), has set out five principles which provide the rationale for the stress test and a guide on how federally regulated financial institutions are to administer the test. Below, based on these principles, I simply want to explain what borrowers can expect when the apply for a mortgage after the end of this year. And I would like to emphasize that, beyond the new universal requirement for mortgage insurance, there is really nothing new that a mortgage applicant would not normally expect.

Principle 1: This Principles is focused on what is expected of federally regulated financial institutions (FRFIs) by way of diligent management of their own affairs. The last four principles relate to what will impact you directly when applying for mortgage.

Principle 2: FRFIs should perform reasonable due diligence to record and assess the borrower’s identity, background and demonstrated willingness to service his/her debt obligations on a timely basis. There’s nothing surprising here. As you would expect, your bank or credit union will check your credit history and past borrowing behaviour. It’s worth noting that if the financial institution uses your credit bureau score, this indicator should not be used solely in the assessment of your reliability to repay the loan. Other basics issues also fall under this principle such as: the purpose of the loan (e.g. purchase of refinancing; debt servicing on other key expenses such as heating, taxes, and other debt obligations; Loan to Value ratio, i.e. property valuation and appraisal documents; property insurance and a commitment to insure the mortgage. There is also requirement to verify the source of the down payment, since there is also federal legislation for anti-money laundering and anti-terrorist financing.

Principle 3: FRFIs should adequately assess the borrower’s capacity to service his/her debt obligations on a timely basis. Again, no surprises here. As you would expect, there will be a verification required on your employment status and income. However, if you derive your income from a source outside Canada, it could pose a challenge to its verification, and the financial institution is instructed to be cautious in such cases. If this applies to you, it would be best to arrange for a clear and easy verification process, perhaps through the foreign financial institution acting on behalf of your source of income. There is some overlap with this principle and principle two, but it’s worth repeating that your ability to pay will include an assessment of such things as principal and interest payments on the mortgage loan; primary and other sources of income; heating costs; property taxes; condominium or strata fees; and payments for all other credit facilities (e.g., unsecured personal loan, second mortgage loan, credit card).

Principle 4: FRFIs should have sound collateral management and appraisal processes for the underlying mortgage properties. This principle sounds very similar to principle 1 insofar as it directs the diligence required of the financial institution for the loan. However, it does cover some required actions which can directly impact the borrower such as assessment methods of the property value, the Loan to Value assessment based on the property assessment; and loan types, whether high or low Loan to Value ratios. These assessments can impact on the financial institution’s need to impose contractual terms and conditions that secure their full protection under laws applicable in relevant jurisdictions, including, where applicable, what legal actions may be taken should the borrower default. Also included under this principle are considerations for Home Equity Loans (sometimes called ‘reverse mortgages’) which form a different category of issues from regular mortgages.

Principle 5: FRFIs should have effective credit and counter party risk management practices and procedures that support residential mortgage underwriting and loan asset portfolio management, including, as appropriate, mortgage insurance. This principle almost goes without saying since it covers the due diligence that a financial institution should undertake in picking the mortgage insurance underwriter. However, it’s worth mentioning here so potential borrowers understand from whom they will they obtain their insurance. The bank or credit union granting the mortgage may arrange for the insurance (to be paid by the borrower) from Canada Mortgage and Housing Corporation (CMHC) or another private mortgage insurance provider. It is also worth noting, therefore, that your financial institution is required by its required due diligence to ensure the underwriting standards of the third-party insurer are consistent with your bank or credit union’s Residential Underwriting Practices and Procedures, and also compliant with the OSFI Guideline, which directs that federally regulated financial institutions should not rely solely on the attestation of the third party.

I have not tried to cover every detail in the new mortgage insurance rules in this blog. For most of my clients, the above review should be sufficient to give them a basic understanding of what to expect when applying for a mortgage starting in 2018. If you wish to read the entire OSFI Guideline you can find it at http://www.osfi-bsif.gc.ca/Eng/fi-if/rg-ro/gdn-ort/gl-ld/Pages/b20_dft.aspx

If anyone would like a more specific review of how the new rules will apply, I would be happy to speak with you personally.

I am experienced in personal financial matters having worked within a Canadian financial institution, in addition to my realtor expertise, and I would be happy to advise you on all aspects of what may be the biggest and most important investment of your life – the selection, purchase and financing of your home. Please feel free to give me a call.

Thanks for reading!

Sibo Zhang, REALTOR®

(604) 779-7992

Your Fraser Valley and Metro Vancouver Market Update


For the last few months I’ve been talking about the curious slowing of price increases for detached homes in Metro Vancouver. The benchmark price in September for a detached property was $1,617, 300, which is only 0.1 per cent higher than August. That’s a remarkable decline in the month-over- month rate of increase, recalling that in July the benchmark price rose above $1-million for the first time. Obviously, there was a big spike as the price moved quickly to the mid-range between $1-million and $2-million.

So, a good question now is why has it levelled off in the last couple of months? Is demand declining at this price point? I believe there are a combination of factors that need to be considered. A general price equilibrium, even for a short period, is also a function of supply – in other words, the available housing stock. If there are a relatively higher number of listings for comparable detached properties, price can become a more competitive issue for the seller. Alternatively, on the buyers’ side, a shift to other types of housing appears to be occurring at this price level. Last month, the ratio of sales to active listings was approximately 15 per cent for detached homes, while townhouses and apartments made up the rest. By way of a general observation then, it appears that the detached home benchmark price is going to remain stable as long as there are new detached listings coming onstream and the supply of townhouses and apartments also remains strong. I would therefore advise those clients who are committed to buying a detached home, that now is a time to strike. This market segment is always going to increase in the long term, so take advantage of a period when price escalation has slowed. For the rest of my clients who are looking at townhouses and apartments, here are my suggestions for good opportunities based on the latest figures.

For townhouses, the benchmark price for September in the Greater Vancouver area was $786,600, while in the Lower Mainland it was $661,600. At less than 50 per cent of the price for a detached home, this category of home is very attractive to young families, many on starting salaries and therefore wanting affordable monthly mortgage payments. This month I have selected some municipalities that have good value while staying on the lower side of average price for the Lower Mainland. These include: Coquitlam at $641,400; Burnaby (East) at $636,500; Port Coquitlam at $635,400; Port Moody at $605,400; Pitt Meadows at $572,900; and Maple Ridge at $514,600.

For apartments, the benchmark price for September in Greater Vancouver was $635,800; and in the Lower Mainland $585,300. Again, I have selected some municipalities which have average prices on the lower side of the Lower Mainland benchmark in order to assist a large number of clients who are on limited budgets. I have excluded Whistler and Squamish in this selection, although there are some attractively priced apartments in these areas if you wish to live father out. For others, I suggest looking in Burnaby North with a bench mark price at $576,700; North Vancouver at $553,500; New Westminster at $488,600; Coquitlam at $482,300; Ladner at $422,800; Tsawwassen at $451,600; Port Coquitlam at $414,200; Pitt Meadows at $392,300; and Maple Ridge at $262,400.

Fraser Valley

Here’s some really interesting news! If you’ve been following my contest for predicting the month when the Benchmark Price for a single detached home in the Fraser Valley would exceed $1-million, you probably bet the winner would be announced this month. In July, the benchmark price for a Fraser Valley single detached residence was $966,000. It couldn’t get much closer then, but now in September, it has declined to $974,500. Will we see it break the $1-million mark this year, or will it continue to decline? I have now changed the rules of my contest to include guesses in either direction. If you can predict – within 0.25 per cent – how much the benchmark price for a detached residence in the Fraser Valley will change by the end of this month, I will prepare a customized Comparative Market Analysis (CMA) of your current property. Each CMA is an estimate of the owner’s house value using its condition, (neighbourhood study), real estate market study, and recently sold homes in the same area.

Send your guesses to zhangsibo@hotmail.com by the end of this month. Be sure to include your name and phone number so we can collaborate on your CMA. Winners will be announced in my newsletter and on my website www.liveincentralcity.ca.

Looking at other types of residences in the Valley, we see the opposite trend. Benchmark prices for both townhouses and apartments increased month of month – 1.4 per cent higher for townhouses (now $498,900), and 2.5 per cent higher for apartments (now $358,200). These increases are understandable since the Fraser Valley is still a popular area for young families and singles who are purchasing their first residence. For these home seekers, I have again selected some areas in price ranges about equal distance on each side of the benchmark price.

For townhouses, these areas are: Langley at $465,200; North Surrey at $507,900; and Surrey at $534,000.

For apartments, look in the areas of: North Delta at $333,000; North Surrey at $344,000; Surrey at $350,900; Langley at $368,500; and Cloverdale at $415,400.

Please let me know if you have a specific price range or other features in mind for the home you are seeking. I can also help you determine an affordable mortgage for your income and the equity you can build in your home. I love to crunch numbers and to help my clients in any way I can.

Thanks for reading!

Sibo Zhang, REALTOR®

Sibo’s Market Update for Metro Vancouver / Fraser Valley Sept. 2017


Let’s start this month with something curious that appears to be happening in the detached home market in Metro Vancouver. You may recall last month when I reported the Benchmark price for a residential property had surpassed the $1-million mark for the first time in July. I said then that this may have created a psychological attitude from a buyer’s point of view, where many home hunters make the decision to look at another market segment, either townhouses or condominiums. This month I can tell you that’s precisely what is happening. But it remains to be seen if I was completely correct or only half right on the whole equation. While there has been a clear spike in sales of townhouses and condominiums, my prediction was that detached family homes would rise in price at a rate faster than before the $1-million threshold. This latter speculation has not yet happened, although it’s too early to detect a trend. The Benchmark price for a detached property in August was $1,615,100, which is only a 0.2 per cent increase over the preceding month. The increase from June to July was 2.1 per cent so for the time being anyway, the detached home price appears not to be escalating. This might be for various reasons, but for anyone wanting to get into a detached home, they should probably move quickly. It’s a safe bet that the price in the Metro Vancouver is not going to decline. What may be keeping the rate of increase this low is an unexpected increase in the supply. Compared to August a year previous, sales of detached homes were nearly 23 per cent higher this year. It may well be that a segment of sellers also held the $1-million mark as their selling point, so I will stick with my longer-term prediction that the rate of increase will pick up once this segment clears in sales.

Metro Vancouver

Looking at the rather hot Metro Vancouver market in August for attached properties, the Benchmark price for a townhouse was $778,300 and for a condo, $626,800, compared with the previous month at, $763,700 and $616,600 respectively. You can see that prices are moving up quickly in this market segment so I have analyzed for you here some areas you may want to check out. I have selected a Benchmark price range for August from the low $600,000s to the low $700,000s combined with areas with lowest month-over-month rate of increase. I think this may be good guide for a large segment of my clients.

For townhouses, Port Moody was at $608,700 with a last month rate of increase of 1.9 per cent. For New Westminster: $652,700 with a last month rate increase of 0.9 percent. For the top of my selected range I am using two areas close in both geographical location and price: Tsawwassen ($720,100 with a negative last month rate of increase of 0.9 per cent) and Ladner ($733,900 also with a negative last month rate of increase at 0.6 per cent). While a single month does not itself show the rate of increase will remain low in the long term, in these cases I think sit is reasonably good indicator of greater price stability than some other areas.

For condominiums, I have selected a Benchmark price in a range from the low $400,000s to the low $500,000, again combined with lowest last month rate of increase. Port Coquitlam was at $412,200 with a last month rate of increase of 2.8 per cent. Coquitlam was $476,900 with a last month rate of increase of 3.8 per cent. New Westminster: $480,000 with a one-month rate of increase of 2.8 per cent. And Vancouver East at $529,000 with a last month rate of increase of 0.9 per cent. As with townhouses, the single month rate of increase is not a long-term predictor, but I think it’s a reasonably reliable indicator for price stability for at least the short term.

Fraser Valley

I’m betting September will be month that the Fraser Valley Composite Benchmark Price (CBP) for a residential property goes over the $1-million mark, as it did in Metro Vancouver in July this year. If you’ve been following my contest, I have been offering a prize to the person who guesses closest to the CBP over $1-million and the month in which it will occur. The CBP for a residential property in the Fraser Valley for July was $966,000. To reach $1-million would require a 3.6 per cent increase over July, which is a big jump for one month. I think it will take two months and if I’m correct we’ll see that when the September statistics are out next month. So, this may be your last chance to make a guess and win a customized Comparative Market Analysis (CMA) of your current property. Each CMA is an estimate of the owner’s house value using its condition, location (neighbourhood study), real estate market study, and recently sold homes in the same area. Send me your guesses (sibo@sibozhang.com) by the end of this month (September 2017). Our winner(s) will be announced in a coming newsletter and on my website. Be sure to include your name and phone number so we can collaborate on your CMA.

The Valley saw, once again, a high demand for townhouses and apartments in August. The Benchmark Price for a townhouse as $491,900 in August, a one month increase of 1.0 per cent over July. For apartments, the BP was $349,300, a one month increase of 2.4 per cent over July. I have many clients wanting to find a quality attached residence in the Fraser Valley so again this month I have selected some areas with an affordable price range.

For townhouses, a price range that many young families are looking for is from the mid-$300,000s to about $500,000. Along with these Benchmark Prices (BP) I have also included the last month rate of increase so you can get a basic idea of the market activity there. For the least expensive townhouses you would have to go as far out as Mission where the BP in August was $392,500 with a 3.0 per cent last month rate of increase. For Abbotsford: $340,500 with 1.9 per cent last month increase. For Langley: $464,500 with a 0.7 per cent last month rate of increase. For North Delta, $501,000 with a 0.6 per cent last month rate of increase. As you can see, the BP rises as you get closer to Metro Vancouver.

For apartments, I know many young people are looking for a residence that is affordable within a starting salary range, so I’ve selected areas with a range of August Benchmark prices from the $200,000s to the mid-$300,000s. This time the least expensive is in Abbotsford at $259,800 with a 1.4 per cent last month rate of increase. Next in price is Mission at $273,200 with a last month rate of increase of 1.5 per cent. North Delta is $324,100 with a last month rate of increase at negative 0.4 per cent. North Surrey at $333,900 with a last month rate of increase at 3.0 per cent. And Surrey at $345,900 with a last month rate of increase at 0.4 per cent. You may have noticed the difference from townhouse prices here, as the least expensive apartments are not necessarily the farthest from Metro Vancouver.

image via biv.com

Thanks for reading!

Sibo Zhang, REALTOR®