surrey bc

Heat and Smoke: Some Tips to Cope

Between extremely hot weather a bit earlier this month and smoke-filled air in the city during the second half, it’s hard not to think that the effects of climate change are being realized even more rapidly than predicted. That’s a big question that I don’t want to presume to know the scientific answer to, but I can provide some space in the blog on some practical advice to deal with these issues. For most of us we can take some common-sense approaches that will help us, but let’s remember that there are others who may need our help, or at least a bit more attention to their well-being. I’m speaking of course about seniors and children.

Let me go first to some tips for dealing with extreme heat. It’s important to take some precautions so you don’t get over-exposed, dehydrated, or worse, faint-headed. I’ve garnered a list of tips from various reliable sources on some of the things you can do to protect yourself, your family and your pets extreme heat.

The Red Cross advises people to take the following steps when it’s extremely hot outside:

  • Never leave children or pets in your vehicle. The temperature inside can quickly reach over 30 degrees Celsius which is dangerous.
  • Keep hydrated. Drink lots of fluids – water is recommended – but avoid caffeine and alcohol.
  • Be careful when entering or leaving air-conditioned buildings; wear a sweater of jacket inside if it is extremely cool in contrast to outside.
  • Wear loose fitting, lightweight clothing outside in the extreme hit. Light colors are better. Dark colors absorb the sun’s rays.
  • Don’t rush. Slow down and don’t engage in strenuous work in excessive heat. Also avoid vigorous games in the heat.
  • If working in the heat, use a buddy system and take frequent breaks.
  • Check on your friends and neighbors, especially if they don’t have air conditioning.
  • Check on your pets frequently, Keep them in shady or cool places, and make sure they have plenty of cool water.

If you don’t have air conditioning, try public places that may offer cool surroundings like libraries theatres and malls.

Now some tips for coping with poor air quality. This is very important for anyone who may suffer from conditions such as asthma, diabetes or heart problems. It is also important for pregnant women, infants, and young children as well as the elderly to take extra precautions with wildfire smoke in the air. B.C.’s Coastal Health has some good tips which I will summarize for you here:

  • Try to reduce your physical activity. When you breathe hard you inhale more smoke.
  • Find a cool place and drink plenty of water, just as you would for extreme heat.
  • If you or someone you care for suffers from asthma or other breathing difficulties, be sure you have appropriate medications on hand.
  • Put off outdoor activities that you don’t need to attend or participate in.
  • Take advantage of air-conditioned areas like malls, libraries and community centres.
  • There are portable air cleaners that use HEPA filters. These are especially good at removing smoke from indoor air spaces.
  • Keep your windows and doors closed if possible. If a breeze is needed on a very hot day, try to limit the amount of time your window is open so you don’t let in too much smoke filled air.
  • Finally, Coastal Health advises you to check the Air Quality Index (AQI) regularly. You can use it to determine which actions you should undertake under different air conditions. There is also an Air Quality Health Index (AQHI) Canada app that will notify you when air quality changes.

As always, stay safe and please enjoy the rest of your summer!

Thanks for reading!

Sibo Zhang, REALTOR®

Surrey’s Fusion Festival 2018

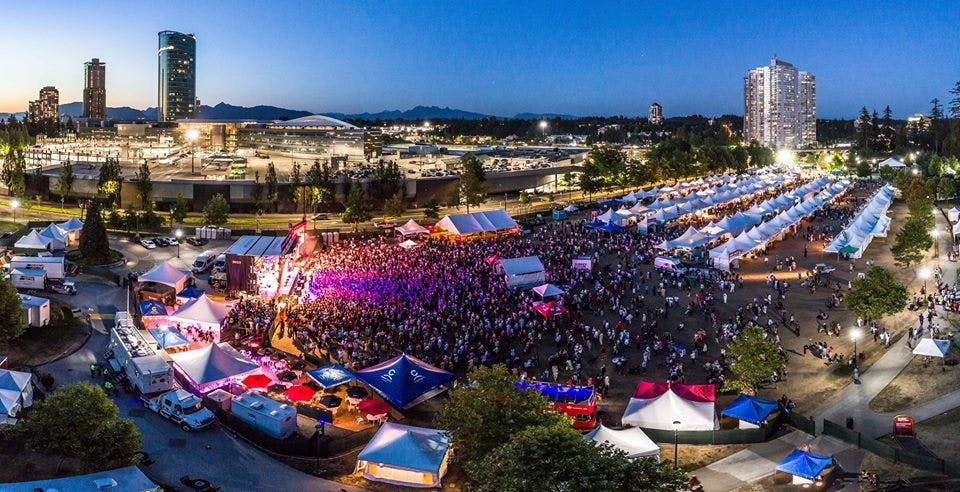
Surrey’s 2018 Fusion Festival was once again a spectacular and successful event! This was the 11th annual Fusion Fest since it first appeared in 2008. Back then it was a three-day festival but today’s two day festival seems the right length for a fun-packed weekend. The crowds were huge. The prediction was for 100,000 visitors this year, and I’m sure it was at least that. Holland Park, where the Festival is located just south of the Surrey Central mall, it seemed like it didn’t have a square inch to spare. In fact, it was the largest Fusion Festival to date with 53 pavilions, and over 150 entertainers of all types – musicians, dancers, and other artistic performers – and of course the greatest variety of national cuisines you could imagine. Last year around this time I wrote about the 2017 Fusion Festival with an emphasis on the entertainment and the international pavilions. This year so this year I will put a nit more emphasis on the great selection of international food. I couldn’t possibly mention every dish that was available at this year’s festival, but if you didn’t happen to attend this year, the following list will give you an idea of what you can try next year. It’s a small sample of the food typical of nations around the world, but it hopefully it will give you a “taste” of what’s available at Fusion.

Foods from around the world

Afghanistan: several varieties of Kebabs; Argentina: Empanadas and Pastalitos; Barbados: fish cakes and Macaroni pie; Chile: Tostadas and Empanadas; China: dumplings and varieties of chow mein; Columbia: pineapples, chozado and Columbian coffee; Cuba: BBQ chicken and roasted pork; Ecuador: mangos and chocolate banana; El Salvador: Pupusa, tostadas and tamales; England: fish and chips, and beef and broccoli; Fiji: Curry chicken and BBQ lamb; France: Crepes both for meals and desserts; Germany: Roasted pork hock sauerkraut and German rye bread; Ghana Fried plantains, and beef and chicken meat pies; Greece: souvlaki wraps and Lukamodes; Guatemala: Tostadas and sugar cane juice: Honduras: Tamarindo and Loroco pupusas: Hong Kong: Hong Kong-style vanilla/chocolate shake and red bean ice cream. India: Fish pakora and chana patura; Indonesia: Chicken satay and corn fritters; Italy: Pasta,meatballs and chickpea salad; Jamaica: Jerk chicken and Curry goat; Kazakhstan: chicken drump steak and kawap; Korea: mango sticky rice and deep fried banana and ice cream; Metis: varieties of bannock and vegetarian chilli; Mexico: Burritos, Tacos and churros; Nepal: Chicken choyla and fish pakora; Nigeria: Jollof rice and cassava sticks; Pakistan: chicken tika with naan; Palestine: Falafel sandwich and Shawarma: Philippines: Chicken adobo and tropical fruits; Russia: Cabbage rolls and bortz. South Africa: Boerewors in a bun and goat stew with pap; South Sudan: Bahlawa and hibiscus drink; Sri Lanka: Panipuri and pao with fries; Taiwan: Deep fried tofu and pudding milk tea; Thailand: Deep fried squid and pad thai; Trinidad and Tobago: Roti (with rice and peas) and curry goat; Ukraine: Perogies with sour cream and cabbage rolls; Venezuela: Cocada (coconut smoothie) and Merengadas (milkshake); Vietnam: Lemongrass chicken and Banh mi.

Live entertainment

The live entertainment this year was outstanding: on Saturday evening the headliner performance by Walk of the Earth was absolutely great, and the whole audience seemed to come together as one. It was a phenomenal performance. Then on Sunday evening, there was another fantastic performance by Ranjit Bawa on the main stage. And all this was free. I don’t know of any other festival where the public could get such a great experience and not have to pay a cent.

Environmental consciousness

The Fusion festival is not only leading edge in cultural entertainment but it environmental awareness as well. This year the festival also continued its environmental protection and for the first time it did not have any plastic straws and used plant-based straws as well as wooden cutlery as well. This is a growing trend. You probably heard about Starbucks getting rid of plastic straws as well. It’s an important issue because plastic straws are not biodegradable and are very bad for landfills. The festival stopped using Styrofoam in 2014 so cups and plates are also more environmentally friendly now.

Great family festival

Before I close, I also want to commend the festival organisers for remembering that many visitors are families with little kids. They did another great job this year of ensuring there were lots of fun activities for little children and this made it a happy place for everyone. Also, with so many people in one place, you might expect some trouble, but the RCMP presence made it a safe and secure atmosphere without spoiling the festive mood. It was as great experience for everyone, and one of the main annual events that Surrey is now famous across Canada.

Just another reason I love this city.

Thanks for reading!

Sibo Zhang, REALTOR®

New Veteran’s Village Development in Whalley

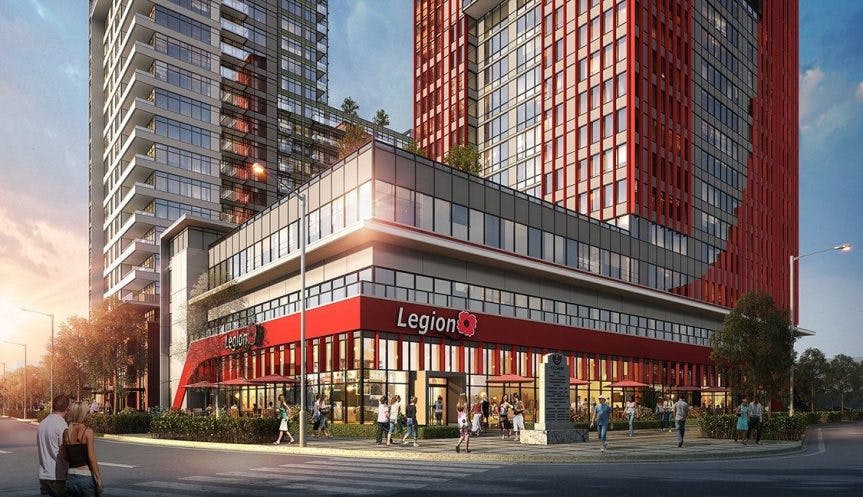
An exciting development project in the Whalley area of North Surrey is back on again! A new Legion Veteran’s Village has been struggling to get launched for a few years now, but this time, the $66-million project is expected to break ground this fall at Whalley Legion property. Surrey City Council gave its approval to the $66-million Legion Veterans Village project on Monday, June 25th. The location of the proposed $66-million project is listed officially as: 110630 City Pkwy., 13525 106th Ave. and 10647 135A Street, and the first phase of the project is to be a 20-story mixed-use tower that will house the Whalley Legion on the main floor, along with a medical clinic, coffee shop and cadet training centre. On the higher floors, the tower would also have 148 rental apartments with 48 affordable rental units for veterans and first responders, along with 10 transitional units which for short-term housing for individuals needing short-term housing upon discharge from a hospital. All of this is great news, not only for the needed space for veterans as well as more affordable rental units for others, but for the overall development of the area.

Project to include Centre of Excellence

One of the great things about this for the veterans is that they will have access to the best and long over-due treatment that the country has to offer. The plans for the building are to house Canada’s first “Centre of Excellence” for treatment of Post-Traumatic Stress Disorder and mental health, along with research and rehabilitation for injured vets. A national centre of excellence is major part of any specialized science or research discipline. It would bring together the best of researchers in their field and generate spin-off developments in technologies and industry, so being a driver of other economic development as well. The centre will focus on robotics and devices to help amputees and other modern neuroscience applications for these highly deserving individuals.

Revitalization and beautification for area

This area of Surrey is rapidly shedding its worn-out look and is being revitalized and beautified with modern buildings all around the Gateway Skytrain station. On City Parkway close to the location of the proposed new tower, there is already new food market, bank, and drug store very convenient for the condo towers and townhouses surrounding the area. The new legion tower will be a great enhancement to the Whalley area and a boost to the living standard for everyone in the neighborhood.

There is also a second phase planned for the Veteran’s Village which will include a second tower beside to be built beside the first one. The proposed second tower would be 26 stories with 14 ground-level townhouses and 311 apartments, all to be available as market residential units.

The latest plans

The architecture of the latest design for the buildings will be very modern, but it is planned to keep with theme for the Canadian war veterans by resembling the famous Vimy Ridge war memorial in Europe. The planned design shows the exterior of the building which faces City Parkway with sun shades that run up the tower to look like the twin towers of the Vimy Ridge monument. The exterior of building will be coloured red in the theme of the annual Remembrance Day poppy that Canadians wear in November. On the other sides of the tower there will also be red shares but in simpler fashion along with silver panels and clear glass walls. In short, the planned building will be a lovely, modern addition to the neighborhood, and a major boost in both use and beautification.

The process

The Veteran’s Village project has been on Surrey’s agenda before. The first design plan was unveiled in 2015 and at that time the project was for two towers to be 20 to 28 floors high. Then in 2016 the design concept was changed to a single tower during the first phase of development and the number of floors was still undetermined. The latest design proposed two phases with one of the two towers to be built in each phase. Following the approval by city council last month, let’s hope it proceeds without delay this time. It will be a great improvement to the neighbourhood and would serve to be a value booster. In addition to serving the deserving veterans it will provide some much-needed market rental units as well. If it goes ahead as planned the developers expect they can break ground this fall, the project could then be completed by 2020 if all goes as expected.

Thanks for reading!

Sibo Zhang, REALTOR®

How Homeowners Can Keep (and Properly Care for) Tropical Fish

A lot of people enjoy fishing for relaxation. I’ve never been one of them, that is someone who stands with hip waders in a river casting a line with hook for hours, or even sitting patiently in a boat drifting for an afternoon waiting for a bite. However, I have discovered a way of enjoying fish. I must admit that watching the tropical fish in my son’s fish tank can be very calming. Warren took up this hobby last year and it came with a lot of responsibility for him. I’m proud of his conscientious care for his fish, and I get to enjoy them while he does everything required to give them the proper care.

Warren did a lot a research before he started his hobby. What kind of fish did he want to care for? What size of tank did he need? What temperature did the water need to be? How would he keep it clean? What did the fish need to eat? What kind of environment did he need create for them inside the tank? These are just some of the questions for which he had to know the correct answers, and he took on the task very seriously.

Like anything that involves looking after some living thing, there are important issues to take into consideration. I recently came across a 2017 article called “The Ethical Issues of Keeping Tropical Fish.” One of the first things the article said was that goldfish were first made pets in China as long ago as 800AD. Of course, being from China, I knew goldfish had been kept in domestic ponds for a long time, but I didn’t realize exactly how ancient this hobby was. The article went on to say that some goldfish have been know to live longer than 40 years. I found that amazing! And in one recorded case, a goldfish grew to be over one and half feet long. Now that opens up the discussion about how big a tank should be. A very large tank, or perhaps an even larger pond, would be needed to grow a goldfish to that size. Of course, there are many different kinds of tropical fish besides goldfish – I will have to ask my son as this is something he knows more about now than me – but he knows exactly how much water they need to have a healthy environment.

His tank is small, and perhaps some day, if he keeps enjoying his hobby as he grows older, he will get a larger one and keep larger fish. But for now, he’s got a number of chores to keep his little fish happy in his bedroom tank. It’s really creates a nice ambience in his room, peaceful and calming. The lighting of the tank can also make a big difference so if you are planning to put a fish tank into a room in your home, keep in mind what kind of lighting will enhance the colour of your room and create the mood you like. Something read in another article on energy consumption was that some fish tank lights can consume a lot of energy and therefore be somewhat expensive to maintain. Of course it depends on the size of the tank. The article said a large tank with live coral and several species of fish could consume several thousand KWh a year, so if you are a major hobbiest this could get expensive since electricity rates are steadily going up. But the editor also said that a small fish tank could consume a little as 150kWh per year.

However, some solutions to this issue have been offered by Matt Clarke, editor of Practical Fishkeeping magazine, who suggested that modern LED lights can help fishkeepers by reducing energy costs. The LED bulbs allow you to replace fluorescent and metal halide lamps which are high wattage and save substantially on your energy bill. All that is good for energy savings, but remember it’s still important to keep in mind what is best for the species of fish you are keeping. Some tropical fish species will require that you create an environment that closely resembles their natural habitat, so it’s something that you need to research before picking up whatever is on your pet store shelf.

Well, as I said at the beginning of the Blog, I get to enjoy the fish and my son gets to do all the research and work necessary to care properly for the fish. He is great with his responsibilities and enjoys the lessons that his tropical fish hobby teaches. And this includes those important moments when he can just gaze into his fish tank and let his mind relax and enjoy the beauty he has nurtured. This is a great arrangement.

If you want to start a tropical fish tank, I highly recommend you encourage your children to enjoy the hobby with you.

Music Lessons for Children

My son Warren won a trophy in his music school recently. I am extremely proud of him of course, but the trophy really represents his love of learning to play to piano. And that has much to do with his teacher and great lessons that make it so enjoyable for him to practice. He’s just been taking lessons since last year but his progress has been so rapid that he can now compose his own music as well as play popular and classical pieces. I’m sure he will enjoy his ability to read music and play the piano when he is an adult, but I started to wonder if there were other benefits to music lessons after reading some research in this area.

One particularly interesting article published in 2017 by the Novak DJokovik Foundation reported all kinds of other benefits arising from children’s music education. According to 2004 study University of Toronto Psychology researcher E. Glenn Schellenberg, six-year children taking weekly music lessons showed a small increase in their IQs. At first I was somewhat skeptical about this claim, but then I read about research conducted by Dr. Eric Rasmussen at Johns Hopkins University which looked at the neuroscience behind this idea. It was discovered that children taking music education have more growth of their neural activity. In other words, playing an musical instrument causes you to use more areas of your brain. This finding was also supported by a study done by Ellen Winner, a Psychology professor at Boston College and Gottfreid Schlaug, a professor of neurology at Beth Israel Deacones Medical Centre and Harvard Medical School. These researchers found changes in brain images in children after 15 weeks of weekly music lessons. What these images supported with visual evidence was the improved sound discrimination and fine motor skills in these children.

Another interesting scientific finding about children who took music lessons was the link between music and spatial intelligence. This means that music can help in the visualization of things that should go together, for example in the kind of problem solving in some types of math problems. It also applies to the kind of skills that are used in architecture, engineering, art, and gaming of the sort designed with computers.

Researcher Mary Mary Luehrisen at the National Association of Music Merchants said that music can also bring significant benefits to children’s formal learning through enhanced language development between ages two and nine. I take it from this that a two-year old is not actually taking music lessons, so it would mean that providing an environment of music for a young child would have beneficial effects. However, I didn’t find what kind of music the two year child was exposed to, and I think this is probably important. I have heard that the classical music of Mozart is very good for children, and I would be naturally inclined to play for my youngster over some heavy metal rock. My son’s piano lessons include classical pieces by great composers like Beethoven and it seems to be proving very effective. As far as Warren’s language development being improved with music, it is probably a bit late to see effects there. He has always been a avid reader, and this helped develop his early language skills. However, research by Yale University researcher Kyle Pruett showed the relationship between language development and music can be the other way around. That is to say, that language development enhances the parts of the brain that process music. So it seems that the link between language development and music works both ways. Other research showed that music lessons actually helped developed the left side of the brain, which is also the side used to process language. I found this very interesting because the left side of the brain is associated with analytical skills such as mathematical problem solving, while the right side is normally associated with intuitive operations like artistic expression. So, it appears these hemispheres of the brain are connected in their functions, just as music and language development are connected.

There is also a broader kind of educational value that has been uncovered in the overall effects of music education. It is that because language competence is the basis of competence in social relationships. It can be seen then that with the verbal capacity strengthened by the child’s musical experience, the child will be inclined to greater social competence.

All of this is very good to know, but it wasn’t the reason my son Warren is taking piano lessons. He just loves learning, and music is its own reward. But nonetheless, I’m very proud of his accomplishment so far.

But the most important thing, I believe, is that is that he enjoys it!

Thanks for reading!

Sibo Zhang, REALTOR®

April’s Market Update for Metro Vancouver and the Fraser Valley

OUR CURRENT RESIDENTIAL MARKET

As we move into the second quarter of 2018, I’m sure everyone is looking forward to more sunshine and fewer rainy days. The weather can be a factor in our outlook and affect our decision-making even on major transactions like buying or selling a residential property. That’s a good reason to pay close attention to some key market trends occurring in local prices and inventories. With so much recent news on new government regulations and taxes on property, it’s easy to develop negative views that are not wholly informed by the facts of the marketplace. Another thing that can contribute to unnecessary pessimism is an over-emphasis on longer term historical comparisons. Regular readers of my monthly newsletter get a picture of the marketplace which is as up-to-date as available statistics make possible, allowing them to understand the where and why of prevailing prices in a context that is relevant to current circumstances. I will continue to breakdown the market segments for each property type in the following geographical regions of Metro Vancouver and the Fraser Valley.

METRO VANCOUVER

In the past month of March there were total of 4,450 new listings in Metro Vancouver which was increase of 5.4 per cent over the preceding February. That’s good news for the active home seeker; yet, it’s fewer than the 4,762 listings that occurred in the same month one year ago. The latter statistic might be of interest in broader academic analysis of the Vancouver residential market, but it’s probably not going to affect a decision to buy or sell at the current time because the prevailing market psychology doesn’t believe that prices are going to move backwards in time. 00 For that reason, I am always talking to my clients to understand what they really want to know for the decisions that are important to them. And what I hear is that you wish to know about what is happening now, and in a context of what it points to in the near term. So here are my selected key metrics based on market activity tabulated on the end of last month.

Across all residential property types in Metro Vancouver there were 2,517 sales at the end of March. This was 14 per cent higher than the preceding month of February, so we can see there is still upward pressure on based on demand and the relatively low increase in new listings. At the end of March, the total inventory of listed homes in Metro Vancouver was 8,380. Breaking down the demand in each property type, we see 14.2 per cent for detached homes; 39.9 per cent for townhouses; and 61.6 per cent for condominiums. The composite Benchmark price for all Metro Vancouver residential properties at the end of March was $1,084,000, an increase of 1.1 per cent over one month. Below I will look at each property type in more detail.

Detached Properties

The Benchmark price for a detached residential property in the Greater Vancouver area at the end of March was $1,608,500, more than half a million dollars above the composite benchmark price for the region. This may give you an idea of a general price level. However,it needs to be considered in relationship to the property types factored into the composite benchmark, which we can look at under their individual headings below. For Single Family Detached homes, the Benchmark price is an average between price extremities of $3,449,000 in Vancouver West (noteworthy: higher than West Vancouver at $3,115,400.) and $606,000 on the Sunshine Coast. I have selected three municipalities closest on the upper side of the Benchmark, and three which are closest on the lower side, where you can see the price change in the past month. On the higher side of the Benchmark were South Burnaby at $1,673,700, a decline of 0.5 per cent in one month; Richmond at $1,708,400, an increase of 0.6 per cent in one month; and North Vancouver at $1,723,200, an increase of 2.2 per cent in one month. On the lower side of the Benchmark are North Burnaby at $1,544,100, an increase of 0.7 per cent in one month; Vancouver East at $1,553,100, a decrease of 0.5 per cent in one month; and Port Moody at $1,484,800, an increase of 0.1 per cent in one month.

Townhouses

The Benchmark price for townhouses in the Greater Vancouver area at the end of March was $835,300, an increase of 2.0 per cent over one month. This average had extremities of $1,271,000 in Vancouver West, and increase of 1.7 per cent in one month; and $575,100 in Maple Ridge, an increase of 4.3 per cent in one month. Excluding Squamish and Whistler for their distance from Metro Vancouver, I have selected three municipalities closest on each side of the Benchmark. On the upper side are Vancouver East at $908,200, an increase of 4.5 per cent in one month; North Vancouver at $1,005,400, an increase of 0.7 per cent in one month; and Vancouver West at $1,271,000, an increase of 1.7 per cent in one month.

Condominiums

The Benchmark price for condominiums in the Greater Vancouver areas at the end of March was $693,500, an increase of 1.6 per cent in one month. The extremities for this average were West Vancouver at $1,278,600 and Ladner at $459,300. Again, excluding Squamish and Whistler because of their distance for Metro Vancouver buyers, here are three municipalities with closest prices on the upper and lower side of the Benchmark, along with their month over month price change: South Burnaby at $727,300, an increase of 2.4 per cent in one month; East Burnaby at $727,800, an increase of 3.0 per cent in one month; and Vancouver West at $844,700, an increase of 1.1 per cent in one month. Closest to the Benchmark on the lower side were Port Moody at $675,000, an increase of 1.0 per cent in month; Richmond at $659,700, an increase of 0.3 per cent in one month; and North Burnaby at $641,600, a decrease of 0.1 per cent in one month.

FRASER VALLEY

The Valley continues to be a very active market which shows no sign of slowing. With Spring around the corner, I urge anyone who is seriously contemplating a purchasing a Valley residence of any type to take advantage of open houses in their desired category. There were 2,865 new listings in March which was a close to a 25 per cent increase from February’s new listings. Keep in mind that new property listings in an active market can attract more prospective buyers, especially as the weather invites more viewers. Even with an increased inventory, demand is still very strong putting upward pressure on prices. At the end of last month there was a total inventory almost 5,000 properties overall. Townhouses and condominiums made up just over 50 per cent of all Valley sales and were the fastest to sell after their listing, on average 16 days for a townhouse and 13 days for a condominium. Single detached homes sold on average in 30 days after listing. Below I examine at each property type by their current Benchmark prices and make some recommendations on which municipalities you might wish to look.

Single Family Detached

A major milestone has been reached in the Fraser Valley. The million-dollar mark for a single detached residence was reached for the first time at the end of March with a Benchmark price $1,001,400, an increase of 0.9 per cent in one month. We have been waiting for several months to see this threshold reached. It now remains to be seen if this will be a psychological threshold as well, both for buyers and sellers. For the former, some prospective buyers may decide they are now priced out of a single detached home and begin to look for a home of another property type. For sellers, we will have to see if the new price level encourages more listings. Focusing on prices closest to this Benchmark average, along with their month-over-month price change, here is my standard selection of three areas above and below the Benchmark. On the upper side of the Benchmark were: Langley at $1.026,600, a decrease of 0.2 per cent in one month; Surrey at $1,031,500, an increase of 1.2 per cent in one month; and Cloverdale at $1,045,400, an increase of 0.8 per cent in one month. Closest on the lower side of the Benchmark price were: North Surrey at $980,100, an increase of 0.8 per cent in one month; North Delta at $950,200, an increase of 0.6 per cent in one month; and Abbotsford at $814,000, an increase of 1.3 per cent in one month.

Townhouses

The Benchmark price for a Fraser Valley townhouse at the end of March was $541,800, an increase of 2.0 per cent in one month. The extremities of this average were South Surrey/White Rock at $678,000 and Abbotsford at $383,000. Municipalities with prices closest to the Benchmark were: On the upper side, North Surrey at $573,800, an increase of 2.4 per cent in one month; Surrey at $577,800, an increase of 1.6 per cent in one month; and North Delta at $591,300, an increase of 1.8 per cent in one month; closest on the lower side of the Benchmark were: Langley at $514,900, an increase of 1.3 per cent in one month; Mission at $446,500, an increase of 3.0 per cent in one month; and Abbotsford at $383,000, an increase of 3.1 per cent in one month.

Condominiums

The Valley Benchmark at the end of March for condominiums was $440,400, an increase of or 4.3 per cent in one month. The extremities for this average were South Surrey/White Rock at $524,100 and Mission at $329,500. Municipalities with prices closest on the upper side of this Benchmark were: Langley at $444,500, an increase of 4.8 per cent in one month; Surrey at $452,300, an increase of 5.8 per cent in one month; and Cloverdale at $507,100, an increase of 3.9 per cent in one month. On the lower side of the Benchmark, the closest prices were in North Delta at $425,900, an increase of 8.1 per cent in one month; North Surrey, at $424,900, an increase of 3.5 per cent in one month; and Abbotsford at $336,600, an increase of 6.6 per cent in one month.

AFTERWORD

In closing, I suggest you pay close attention to any trends you may spot in the month-over-month increases in Benchmark prices that I mention in each newsletter. This may help you see where prices are driven by demand and as you become familiar with increases – or decreases – in the short term, this may assist your decision making. However, keep in mind that there may be other factors that cause price changes which is out of the usual range. If you have any questions and need specific information on any housing type in any of the areas in the lower mainland, please don’t hesitate to call me. I keep an close eye on the residential market, and I want to help my clients find what they are looking for, or to make a listing decision when the time is right.

Thanks for reading!

Sibo Zhang, REALTOR®

B.C.’s New Real Estate Taxes – Part 2

The Additional Property Transfer Tax

As mentioned in my last blog in March, one of two new real estate taxes announced by the B.C. government in its 2018 budget this past February is the Additional Property Transfer Tax. In this blog I will provide an outline of the measures covered by this tax and highlight some of the main points that could affect current B.C. property owners and prospective home buyers.

Prior to February 21, 2018, the property tax transfer rate was 15 % on properties in the Greater Vancouver Regional District. After February 21, the transfer tax increased from 15 % to 20 %, based on the fair market value at the time of registration for property transfers in the following areas in the province of British Columbia:

  • Greater Vancouver Regional District
  • Capital Regional District
  • Fraser Valley Regional District
  • Regional District of Central Okanagan
  • Regional District of Nanaimo

Two Important Exceptions

Excluding the Greater Vancouver Regional District, the remaining four regions noted above have two instances where you don’t have to pay the additional transfer tax on property transfers after February 21: First, you don’t have to pay if you register before, or on, May 18, 2018, as long as the property transfer is subject to a written agreement dated on or before February 20, 2018; and second, if the transfer is subject to a court order dated before February 20, 2018, or several other specific legal conditions on property transfers related to divorces, separations, or estates of deceased persons. I advise you to get advice from your lawyer if any of these situations applies to you.

As a general guide, the changes introduced on the property tax transfer took effect February 21, 2018. If you purchase a property that is registered at the provincial Land Title Office, you will need to pay certain transaction costs which are taxable. Without going into the details of the various legally required transactions – which your Realtor can explain to you – I want to point out to you that you can qualify for a reduced tax if you are: a) purchasing your first home; or b) purchasing a newly built home.

The tax is calculated on the fair market value at the time of property registration. Note that properties on the Tsawwassen First Nation lands are exempt from the additional property transfer tax. There are also two other exemptions which I would advise you get legal advice if you not sure they apply to you. The first is any exemption that applied to you for the previous property tax transfer also exempts you from the additional transfer tax, except in the following situations: i) a transfer resulting from an amalgamation; ii) a transfer to a surviving tenant; iii) a transfer where the transferee is or becomes a trustee in relation to the property, even if the trust does not change; and second, if you are confirmed B.C. Provincial Nominee and certain criteria are met for foreign nationals under the B.C. Provincial Nominee Program.

Foreign Nationals and Foreign Entities

If you are a confirmed under the B.C. Provincial Nominee Program when the property transfer is registered with the Land Title Office; ii) the property is to be used as your principal residence; iii) the property transfer is made to an individual. Note that the additional property transfer tax does NOT apply to registration of mutual fund trusts, real estate investment trusts or specified flow-through trusts. You should also note that if you were confirmed as a B.C. Provincial Nominee between August 2, 2016 and March 17, 2017, you might be eligible for a refund of the additional transfer tax if you paid it.

If you happen to be a foreign national, a foreign corporation, or a taxable trustee, there is also an additional transfer tax on residential properties in certain areas of British Columbia, as listed above.

This summary of the new Additional Property Tax is based on information provided by the Government of British Columbia. I have summarized what I think are the major points of interests for my clients; however, like any tax measures, there are always situations that may require more in depth information. I would recommend that if you think you may be in such a situation that you talk to a knowledgeable tax lawyer about your specific situation. I hope the above summary has informed you adequately to understand if the new transfer tax may apply to you, You may find additional information on the new transfer tax at: B.C. Provincial Budget Tax Changes.

I will watch for any changes in these tax rules and report what I see in the blog space. Please feel free to ask for any advice that I might be able to provide. I’m always happy to help in any way I can.

Thanks for reading!

Sibo Zhang, REALTOR®

Your March Market Update for Metro Vancouver and the Fraser Valley

If you happened to read the news story in the Globe and Mail at the beginning of the month, the headline surely intrigued you: “Vancouver housing sales fall 9 % in February.” The story behind the decline is really the more important consideration for prospective home buyers. As a statistician, I always want my clients to understand the reason when a number is cited.

First, the February sales decline is for all property types across Metro Vancouver, so we will have to look more closely at the different categories. Based on ten-year sales average, February’s sales for all property types were down 14.4 per cent; detached sales declined 39.4 per cent; townhouse declined 6.8 per cent, but condominium sales rose 5.5 per cent above the 10-year average. Second, the 9 per cent decrease is a comparison with February sales in 2017. It’s a significant percentage, but the actual number of sales for the respective months were 2,207 in 2018 and 2,424 in 2017, so in practical terms not really a huge difference. And the number of sales in February this year was a monthly increase of 21.4 per cent over January, so it’s important to recognize that the market is still very active. The composite benchmark price for all residential properties in Metro Vancouver at the end of February was $1,071.800, a 16.9 per cent increase year-over-year and a 1.4 per cent increase since January this year. It will be important to watch these two price levels in coming months.

What the newspaper story was really about what may be the beginning of fewer sales each month following the provincial budget announcements in February that impact out-of-province buyers. The BC government has targeted speculative buyers with an additional tax as well as increasing and expanding the foreign buyers tax beyond Metro Vancouver. I will talk more about these tax measures in my next Blog, but for now I will focus on the market place prices for prospective local home buyers and sellers.

Detached Properties

The benchmark price for a single detached property in Greater Vancouver at the end of February was $1,602,000, an 8.2 per cent increase from the February 2017, and a 1.9 per cent increase from January this year. The extremities of this average range from a high in Vancouver West (higher than West Vancouver, and excluding Whistler) at $3,500,600 to a low in low in Maple Ridge at $847,700. That’s obviously quite a large spread, so I’ve selected three areas on each side of the Benchmark where you can find properties closest to the Metro Benchmark at the end of February. On the higher side, the Burnaby South Benchmark price was $1,682,600, an increase of 0.9 per cent over the previous month. North Vancouver’s Benchmark was $1686,800, an increase of 1.0 per cent over the previous month; and Richmond’s Benchmark was $1,697,900, an increase of 0.4 per cent over the previous month. On the lower side, the Vancouver East Benchmark was $1,560,400, a decrease of 0,2 per cent from the previous month; the Burnaby North Benchmark was $1,532,700, a decrease of 2.2 per cent from the previous month; and Port Moody’s Benchmark was $1,483,700, a decrease of 0.7 per cent from the preceding month.

Townhouses

The Benchmark price for a townhouse in Metro Vancouver at the end of February was $819,200. This average was made up of prices ranging from a high of $1,250,100 in Vancouver West to a low of $551,400 in Maple Ridge. I have again selected three areas on each side of the Benchmark which are closest to the Benchmark at the end of February. On the higher side, almost identical to the Metro Benchmark was the Richmond Benchmark at $819,500, a decrease of 0.4 per cent from the previous month. The Benchmark for Vancouver East was $868,900, an increase of 1.3 per cent from the previous month; and the North Vancouver Benchmark at $998,400, an increase of 0.7 per cent from the previous month. On the lower side, the Benchmark for Burnaby South was $807,600, an increase of 2.7 per cent over the previous month. The Tsawwassen Benchmark was $756,000, a decrease of 0.9 per cent from the previous month; and the Ladner Benchmark at $783,200, an increase of 0.9 per cent from the previous month. In this breakdown, I have excluded Whistler as I normally do for areas farther out than my clients wish to look.

Condominiums

The Metro Vancouver Benchmark price for condominiums at the end of February was $682,800. The extremities of this average ranged from a high in West Vancouver at $1,237,100 to a low in Maple Ridge of $307,800. Here is my selection of three areas closest on both sides of the Benchmark. On the higher side, the Benchmark for Burnaby East was $706,700, an increase of 2.6 per cent over the previous month. The Benchmark for Burnaby South was $710,100, an increase of 1.8 per cent over the preceding month; and Vancouver West’s Benchmark at $835,800 was an increase of 2.9 per cent over the previous month. On the lower side, the Benchmark for Port Moody was $668,300, an increase of 4.0 per cent over the previous month. Richmond’s Benchmark at $657,800 was an increase of 1.2 per cent over the previous month; and the Burnaby North Benchmark at $642,500 was an increase of 3.9 per cent over the previous month. These selections are made to guide my clients who are looking to purchase, or sell, one of these property types within the Metro Vancouver region based on the mid-range prices of comparable properties.

There are of course many properties in areas outside the mid-price range I have focused on in my selections above. If you would like to learn more about prices in any other areas of Greater Vancouver, I will be happy to help you find a property that fits your mortgage range. Please feel free to give me a call.

FRASER VALLEY

There was also a decrease – a small one — in the year-over-year number of February sales in the Fraser Valley, a mere 0.8 per cent decline. However, the Valley continues as a high demand area, noted by February’s 14.5 per cent increase over January 2018 sales activity. As has been the case for many months, attached properties – townhouses and condominiums – together represented more than half of all the transactions. Fraser Valley home seekers can again be buoyed with the fact that inventory in February increased 9.5 per cent over the preceding month, bringing the total supply of properties on the market at the end of February to 4,340.

For anyone thinking about listing their property for sale, it is nonetheless a good time because demand continues to be greater than the 10-year average for this time of year. During the month of February, detached properties took on an average of 38 days to sell, while townhouses sold after an average of 28 days, and condominiums on an average of 13 days. I highly recommend home purchases in the Fraser Valley at this time. Prices on average are still below those of comparable properties in Metro Vancouver. The composite Benchmark price for all property types in the Fraser Valley at the end of February was $795,100. For this reason, it is a favorite starting area for young families and singles often looking in the townhouse and condominium market segment. However, there is excellent value to be found in all housing types, and for families who want to start with a detached property, or perhaps move up to detached home from their existing townhouse, the Valley has very good prices. I will review the Benchmark prices for each property type in the space below and will make some recommendations on which areas you might wish to look for your preferred price range.

Detached Homes

The Benchmark price for a single family detached home in the Fraser Valley was $992,100 at the end of February, an increase of 1.0 per cent over the preceding month, and a 15.7 per cent increase year-over-year. Compared with the Metro Vancouver Benchmark of $1,602,000 for a comparable property, you can see why this is an attractive investment. The extremities of this average are not as far apart as Metro Vancouver areas, with South Surrey/White Rock at the high end at $1,482,800 and Mission at the low end at $663,500. Closest to the Valley Benchmark on the higher side at the end of February were: Cloverdale at $1,036,600, a 2.2 per cent increase over January; Langley at $1,028,200, a 0,4 per cent increase over January; and Surrey at $1,019,500, an increase of 0.6 per cent over January. Closest to the Valley Benchmark on the lower side were: North Surrey at $972,100, an increase of 0.6 per cent over January; North Delta at $944,800, an increase of 0.4 per cent over January; and Abbotsford at $803,300, an increase of 2.2 per cent over January.

Townhouses

The Benchmark price for townhouses in the Fraser Valley was $531,000 at the end of February. This average is from the extremities of $656,000 in South Surrey/White Rock and $371,600 in Abbotsford. Closest on the higher side of the Benchmark were: North Surrey at $560,200, an increase of 3.1 per cent over January; Surrey at $569,000, an increase of 2.1 per cent over January; and North Delta at $581,000, an increase of 0.4 per cent over January. Closest to the Benchmark on the lower side were: Langley at $508,500, an increase of 1.9 per cent over January; Abbotsford at $371,600 and increase of 2.7 per cent over January; and Mission at $433,400, an increase of 0.3 per cent over January.

Condominiums

The Benchmark price for condominiums in the Fraser Valley was $422,300 at the end of February. The extremities for this average were $519,00 in South Surrey White Rock and $315,400 in Mission. Closest to this Benchmark on the higher side were: Langley at $424,300, an increase of 4.3 per cent over January; Surrey at $427,400, an increase of 6.3 per cent over January; and Cloverdale at $488,100, an increase of 4.0 per cent over January. Closest on the lower side of the Benchmark price were: North Surrey at $410,400, an increase of 4.8 per cent over January; North Delta at $394,100, an increase of 4.8 per cent over January; and Abbotsford at $315,900, an increase of 5.3 per cent over January.

I selected the above areas to assist you in your search for a home to fit your mortgage capability. Keep in mind that the Benchmark prices are a comparison of comparable properties in their respective categories.

If there is any area that you would like to get more specific information on prices in any area, please feel free to call me. I keep a close eye on new listings and changes in prices, and I am always happy to help in any way I can.

Thanks for reading!

Sibo Zhang, REALTOR®


March in Surrey

Let’s hope Spring weather is on its way this month of March. There’s so much to do in Surrey this month, we will be eager to get around. By the end of the month, we can test the old saying: “If March comes in like a lion, it goes out like a lamb.” What this means is that if weather at the beginning of March is like a lion – blustery, cold, maybe snowing – then the end of March will be gentle – calm, warm, sunny. The general idea is that the weather at the end of March is supposed to be the opposite of the beginning. We will have to wait and see, but there are many activities around our city to take our minds off the weather.

Here are events throughout the month to help you plan some activities for the whole family.

Some of the many things to do in Surrey this month of March

On March 1 at the Surrey Art Gallery is an evening show (7:30 to 9:00 pm) by artists Erica Grimm, Tracie Stewart and Sheinagh Anderson entitled “Skin Boats and Ocean Surroundings.” The show deals with problems of climate change and the changing ocean environment. The installation of the artists’ salt water skin boats – designed to resemble human skin – and the accompanying soundscape uses analogies between human bodies and the ocean to create a connection between participants and the ocean.

On March 1 and March 15, youth and young adults (ages 15 to 30) are invited to join the Community Art Planning Team. This group creates different art projects to enliven and brighten neighborhoods through Surrey. The meeting locations are to be determined, and you can get information by phoning 604-591-4194.

On March 4 (2:30 pm to 4:00 pm) at the Surrey Art Gallery, you can explore and enjoy indigenous art from India. There will be a panel of experts to discuss the art and provide insights for visitors to the show.

On March 8 at the Kensington Prairie Recreation Centre (4:30 p.m. to 6:30 p.m.) is hosting the Kinder Café Kindergarten. This event is for parents, but you can bring your children and learn how they can be prepared for kindergarten. You can register your child for the child minding service there as well, so you can concentrate on the lesson. To register call 604-592-2605 and use reference code 4565025.

On March 9, enjoy Family Movie Night at the Fleetwood Community Centre (6:30 p.m. to 8:30 p.m.) You can wear your pyjamas and cover up in your own blanket while you watch a family movie together, complete with popcorn and other treats. You can enjoy this family event for free, but you will need to register for your spot. Phone 604-501-5100.

On March 10 at the Surrey Archives from 11:00 a.m. to 12:30 p.m. local history buffs can enjoy discovering the photos by the legendary Surrey Newsman Stan Mckinnon. Pictures of Surrey residents, businesses and landscapes in the 1950s and 1960s are featured. For registration information phone the Surrey Archives at 604-502-6459.

On March 13 at the Cloverdale Recreation Centre there is Movie afternoon from 1:00 p.m. to 3:00 p.m. This is an afternoon the whole family can enjoy together with classical and other great family movies. Register by phoning 604-501-5100.

On March 17, the Surrey Nature Centre will hold a birding walk from 9:00 a.m. to 11:00 a.m. This nature lover’s event will meet in the Nature Centre’s parking lot and then walk along the forest trails to Green Timbers Lake where they can observe osprey and cormorants fishing for rainbow trout.

On March 18 from 11:00 a.m. to 3:00 p.m. the Surrey Art Gallery will host Family Day. This fun-filled day will include creating your own art with paint, pastels, clay, and chalk. There will also be interactive musical performances from 1:00 p.m. to 2:30 p.m. as well as the Art from Indigenous Communities in India in case you missed it on March 1. This is a free event, but children must be accompanied by an adult.

On March 19, from 6:00 p.m. to 7:00 p.m. the North Surrey Recreation Centre will hold an information session on getting started in lifeguard or aquatic instructor courses. The session will inform you on training process and volunteer opportunities. This is a free event, but participants must be age 10 or older. You can phone for information at 604-501-5100.

On March 21 at the Guildford Recreation Centre from 10:00 a.m. to 2:00 p.m. celebrate the beginning of Spring (first day of Spring is March 20). There will be lots of fun family activities to launch the season of Spring this year.

On March 24 at the Guilford Recreation Centre, the second annual Active Aging Resource Fair takes place from 9:00 a.m. to 3:00 p.m. There will booths to connect with others and to learn about new technologies as well as health, nutrition, travel, and fitness. For more information you can phone: Carissa Bootsma at 604-591-4274.

Have we missed anything? Be sure to leave your comments of fun activities to check out this March in Surrey, BC.

Thanks for reading!

Sibo Zhang, REALTOR®
Your February Real Estate Recap for Metro Vancouver and the Fraser Valley

METRO VANCOUVER

As we move into the second month of 2018, average price levels across all property types continue to inch upwards, or remain the same as last month. However, it’s worth keeping in mind that even a modest price increase of less than 1.0 per cent can add several thousands of dollars to home when we are in a market where the composite benchmark price for all residential properties, based on last month’s closing figures of the Real Estate Board of Greater Vancouver, is $1,056,500. Since my January newsletter, when this same benchmark was $1,050,000, you can see the actual difference. So, once again, my general advice to anyone who needs to find a home before being outpriced, is not to delay because it’s likely you will pay more in the future for a similar property. That said, I am still continually scouring the market for any specific good buys for my clients that can get overlooked in a general average.

Some good news this month is that there were 3,796 new listings across all property types on the Multiple Listing Service for Metro Vancouver. This brings the total inventory of listed properties to 6,947, which provides a wide choice selection, although admittedly in a high demand market. Looking at the sales in each property type last month, we continue to see the greatest number was for condominiums with 57.2 percent, followed by townhouses with 32.8 per cent. Detached homes remained in the last place, as has been the trend for several months. Looking at the actual number of sales in each category last month, we can compare these figures with one year ago to see the underlying upward pressure on price levels now in place. Detached home sales in last month were 487, an increase of almost 10 per cent over January sales in 2017. The current benchmark price for detached properties in Metro Vancouver is $1,601,500, an increase of just over 8 per cent since January 2017. Condominium sales last month were 1,012, an increase of almost 23 per cent since January 2017. The current benchmark price for a condominium in Metro Vancouver is $665,400, an increase of slightly more than 27 per cent over January 2017. Townhouse sales last month were 319, almost 26 per cent higher than sales in January 2017. The benchmark price for a Metro Vancouver townhouse is currently $803,700, an increase of almost 18 per cent since January 2017. Although the correlation between the increase in sales and the increase in price here is a bit rough, there appears to be relationship between the monthly number of sales and the price increases that is somewhat in synch. You might want to use this a rule of thumb, though not a perfect one, for predicting future price increases in whatever property category you are searching. I will keep you informed of monthly sales and prices in each of my newsletters.

Detached Properties

There is quite a large difference between the extremes in prices for Single Family Detached homes across Metro Vancouver. Excluding areas such as Whistler and Sunshine Coast which are farther out than my clients are looking, here is the range of the prices that make up the benchmark price of $1,601,500. In West Vancouver and Vancouver West, the benchmark price is, respectively, $3,099,500, and $3,548,400. On the other end of the scale are Maple Ridge and Pitt Meadows, at, respectively, $833,600 and $904,600. Only Burnaby South, Richmond and North Vancouver are higher than the Metro Vancouver benchmark, while other municipalities are currently below. In each of the middle-priced municipalities, the prices are close to the Metro Benchmark. I will be happy to supply anyone looking to buy a detached property an exact benchmark for the desired area if you would like to contact me.

For the other property types, I have made the following area selections based on current price changes.

Townhouses

The benchmark price for townhouses in Metro Vancouver, excluding Whistler and Squamish, remained unchanged since the previous month’s figures at $665,400. The extremities of the average in January ranged from $1,247,900 in Vancouver West to $533,800 in Maple Ridge. Two municipalities showed a one month decrease: Vancouver East with a benchmark of $857,600 was a drop of 2.5 per cent from one month previous, and Ladner at $776,000 was a one month decrease of 0.1 per cent. Most of the other municipalities had small increases below 1.0 per cent. But there were three notable exceptions where the month-over-month benchmark price was somewhat higher: Burnaby South showed the biggest jump with a 2.8 per cent increase to $786,400; Richmond had one month increase of 1.8 per cent to $822,500; and Burnaby East increased 1.3 per cent to $667,900.

Condominiums

The benchmark price for condominiums in Metro Vancouver, excluding Whistler and Squamish, showed a 1.5 per cent increase over one month. The benchmark average had extremities of $1,179,400 in West Vancouver, which was a one month increase of 0.7 per cent; and $291,500 in Maple Ridge, a one month increase of 3.3 per cent. Notably, the one month increase in Maple Ridge was the highest across Metro Vancouver, followed by a 3.2 per cent increase in Pitt Meadows to $436,200. The third highest monthly increase was in Burnaby North at $618,400. It is worth observing that the largest monthly increases appear to be happening in the lower priced market segment. Since condominiums are often the entry level for residential property owners, I would recommend that this category of buyers, often singles or young couples, not delay in making a purchasing decision if your budget down payment and mortgage are already determined.

FRASER VALLEY

The Valley market showed one of the strongest January sales volumes ever, with 1,210 sales across all property types. This was a 24 per cent increase for January sales since 2017, and third highest January on record with the Fraser Valley Real Estate Board. The January benchmark price for a Fraser Valley Single Detached property $982,700, still under the $1-million mark and only a slight increase 0.6 per cent from the preceding month. Note that this was a over a 15 per cent increase year over year, which is a good reflection of the market activity in this region. The greatest sales activity, however, continues to be for townhouses and condominiums, which represented 51 per cent of all sales in January. Of the total number 1,210 of residential sales, 281 were townhouses, and 338 were condominiums. It is important to note that demand is outpacing supply in the Fraser Valley. While there were 2,092 new listings in January, which brought the total Valley inventory to 3,962, there continues to be an increasing number of potential buyers, so prices overall are moving upwards, although not with any alarming increases. I will be happy to show provide specific and current benchmark prices for single detached properties to anyone shopping in the that category, but with most Fraser Valley clients looking for the other two property types I will focus on these segments here.

Townhouses

The January benchmark price for a Valley townhouse was $519,400, a 1.2 per cent increase from the preceding month. Again, I point out that this price level is a year over increase of 23.4 per cent so it is important keep in mind that delayed purchasing decisions in this current market can be costly. The current benchmark average price has relatively narrow extremities ranging from a high in South Surrey/White Rock at $664,200 to a low of $361,800 in Abbotsford. Interestingly, the South Surrey/White Rock price is a 0.5 per cent decrease from the preceding month. All other municipalities show modest month-over-month increases. The areas with the three largest month-over-month benchmark price percentage increases were: Mission at $432,000, an increase of 3.7 per cent; Langley and North Surrey both had monthly increases of 1.9 per cent, bringing their prices, respectively, to $499,200 and $543,400; and Abbotsford, at $361,800, a monthly increase of 1.7 per cent.

Condominiums

The January benchmark price for a condominium in the Fraser Valley was $404,100, a month-over-month increase of 4.0 per cent. The extremities of this average range from $507,400 in South Surrey/White Rock, an increase of 4.0 per cent from the preceding month to $300,100 in Abbotsford, an increase of 4.7 per cent from the preceding month. The three municipalities with the biggest month-over-month increase in this segment’s benchmark price were Surrey, with an increase of 5.2 per cent bringing its January benchmark to 402,000; Abbotsford, with an increase of 4.7 per cent bringing its January benchmark to $300,100; and Cloverdale, with an increase of 4.6 per cent, for a January benchmark of $469,300. Again, I would draw attention to larger percentage increases often occurring in the lower end of the market prices. For entry level buyers, I would advise if you are looking for condominium to get started, that you don’t delay too long as prices are moving up in this market segment.

If any of my newsletter readers would like a personal and confidential consultation on your home requirements, I would be very happy to advise you. I have experience in both finance and Real Estate, and pay close attention to the market.

Please feel free to give me a call. I am here to help!

Thanks for reading!

Sibo Zhang, REALTOR®